Population overview
Because of its draw as a destination for migrating talent, metro Austin's population surpassed 2.0 million in 2015. The decade ending 2020 saw a 33.0% increase in population, and growth was 3.0% for the year ending July 2020. Census Bureau estimates show that Austin remains one of the top destinations for migrating talent. Austin ranked first among the 50 largest U.S. metros based on net migration as a percent of total population in 2020. In addition, 7.6% of Austin residents in 2021 lived elsewhere one year earlier. That is the largest rate among the top 50 U.S. metros.
Spreadsheet version of data on the Population pages
Download .xls
Population & population growth
2000 | 2010 | 2020 | PERCENT CHANGE | ||
|---|---|---|---|---|---|
2000-10 | 2010-20 | ||||
| Austin MSA | 1,249,763 | 1,716,289 | 2,283,371 | 37.3% | 33.0% |
| Bastrop Co. | 57,733 | 74,171 | 97,216 | 28.5% | 31.1% |
| Caldwell Co. | 32,194 | 38,066 | 45,883 | 18.2% | 20.5% |
| Hays Co. | 97,589 | 157,107 | 241,067 | 61.0% | 53.4% |
| Travis Co. | 812,280 | 1,024,266 | 1,290,188 | 26.1% | 26.0% |
| Williamson Co. | 249,967 | 422,679 | 609,017 | 69.1% | 44.1% |
| Texas | - | - | - | 20.6% | 15.9% |
| United States | - | - | - | 9.7% | 7.4% |
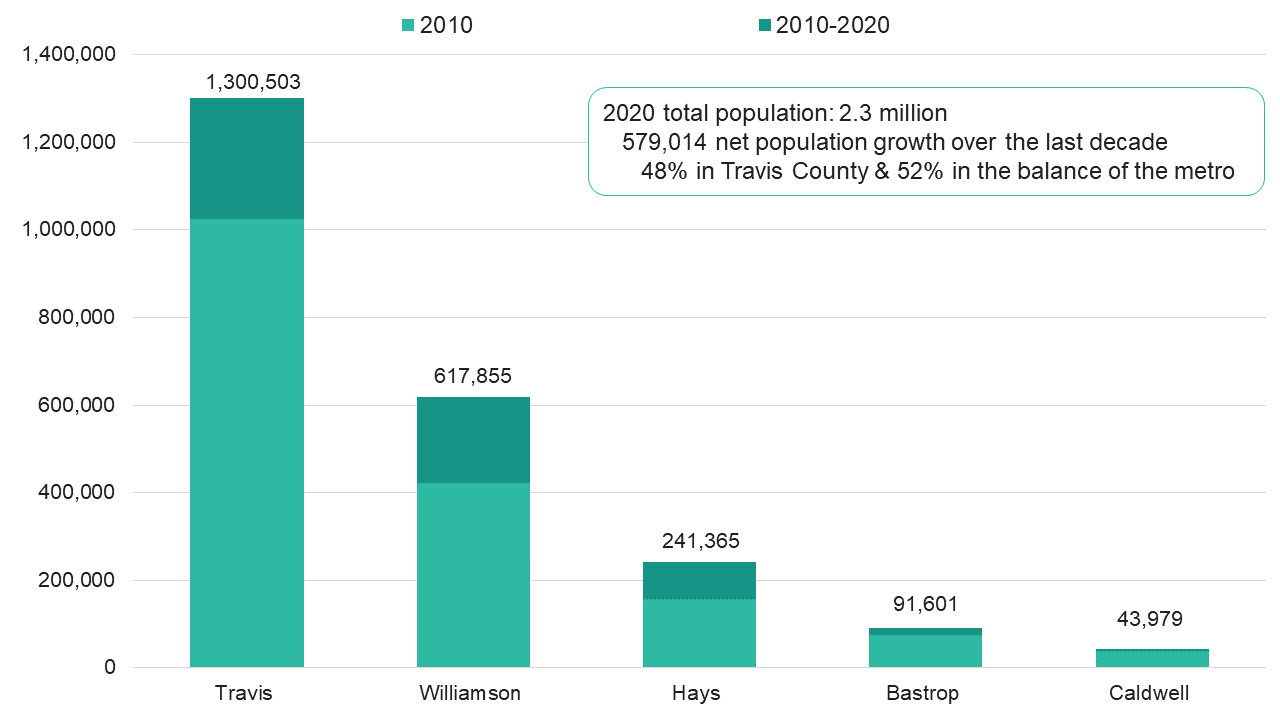
Population growth 2010-2020

Source: U.S. Census Bureau, Decennial Census.
Population by county
Source: U.S. Census Bureau, Population Estimates.
Population projections
2020 | 2030 | 2040 | 2050 | 2060 | |
|---|---|---|---|---|---|
| Austin MSA | 2,286,371 | 2,918,491 | 3,611,330 | 4,371,108 | 5,237,825 |
| Bastrop Co. | 97,216 | 120,901 | 150,018 | 184,520 | 223,711 |
| Caldwell Co. | 458,836 | 537,494 | 61,689 | 69,133 | 76,291 |
| Hays Co. | 241,067 | 356,181 | 513,812 | 721,388 | 1,031,309 |
| Travis Co. | 1,290,188 | 1,572,639 | 1,820,417 | 2,035,923 | 2,252,137 |
| Williamson Co. | 609,017 | 815,021 | 1,065,394 | 1,360,139 | 1682,556 |
Population growth rates
2020-2030 | 2030-2040 | 2040-2050 | 2050-2060 | |
|---|---|---|---|---|
| Austin MSA | 27.8% | 23.7% | 21.0% | 19.8% |
| Texas | 12.9% | 11.8% | 10.4% | 9.2% |
Source: Texas State Data Center, 2022 Population Projections.
Net migration per 10,000 population, 2010-2020
50 largest metros

Source: U.S. Census Bureau, Population Estimates.
Population growth maps
Download