Personal Income
Posted on 12/05/2017 by Beverly Kerr
- Total personal income in the Austin metro grew by 3.8% in 2016, the 15th fastest growth rate among major metros.
- Over the last five years, per capita income grew 20.0% in Austin, compared to 16.2% for all metros.
- Austin is the 6th best performing major metro based on growth in average wages and salaries per job over the last year and past five years.
Personal income totaled $106.0 billion in the five-county Austin metropolitan area in 2016 according to the latest annual release by the U.S. Bureau of Economic Analysis (BEA) of personal income data for metropolitan areas and counties. Austin’s total personal income rose 3.8% in 2016. Growth was 7.5% in 2015. Personal income is the broadest measure of local economic activity available,[1] with the exception of gross domestic product by metro.

All but thirty of the nation's 382 metropolitan areas saw personal income growth in 2016. In aggregate, growth was 2.5% for the metropolitan portion of the U.S., down from 5.3% in 2015. Growth ranged from -7.7% in Odessa, TX to 7.7% in Bend, OR.
Austin’s 3.8% growth in personal income from 2015 to 2016, was the 15th fastest rate of growth among the 50 largest metros. Nashville’s 5.4% growth was the highest among large metros. Houston and New Orleans were the only major metros with negative growth (-1.8% and -0.9% respectively). Within the Austin metro, growth ranged from 2.9% in Travis County to 6.4% in Hays County. Texas’ growth was 0.4%, down from 3.9% in 2015.

Austin's personal income growth over the last five years is 38.6%, better than all but one of the 50 largest metros and substantially above the 21.3% growth for metropolitan portion of the U.S. San Jose’s growth over the last five years is 41.9%.
Austin's robust population growth and job growth (among large metros, Austin is No. 1 for growth in both measures over the last five years) would be expected to drive relatively strong aggregate personal income and earnings growth. Therefore, growth in per capita income and in earnings per job would be measures to look to for an indication of relative improvements in Austin’s standard of living.

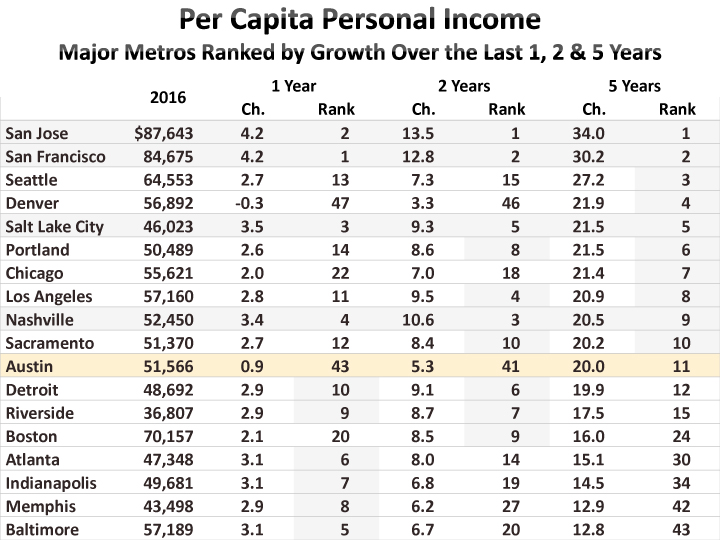
In 2016, per capita personal income is $51,566 in Austin, 1.0% above that of the metropolitan portion of the U.S. Austin’s per capita personal income has exceeded the metro average for the last five years. The only previous period in which Austin had higher per capita income than the metro average was from 1998 to 2002. Among the top 50 metros, Austin ranks 19th for per capita personal income.

Austin’s per capita income growth over the last five years is close to the top ranks—Austin’s 20.0% growth exceeds the 16.2% growth for the metropolitan portion of the U.S. and places it 11th among major metros. However, over the past year or two, Austin underperforms. In 2016, Austin’s per capita income is up 0.9%, compared to 1.7% for all metros and over the last two years, Austin is up 5.3%, compared to 6.2% for all metros.
Other measures produced by the BEA’s local area personal income estimates include average earnings per job, a measure comprising earnings of both wage and salary workers and proprietors;[2] average compensation per job, a measure of total compensation to wage and salary workers (i.e., wages and salaries, plus employer contributions for pensions, insurance funds, and government social insurance programs); and average wages and salaries per job.

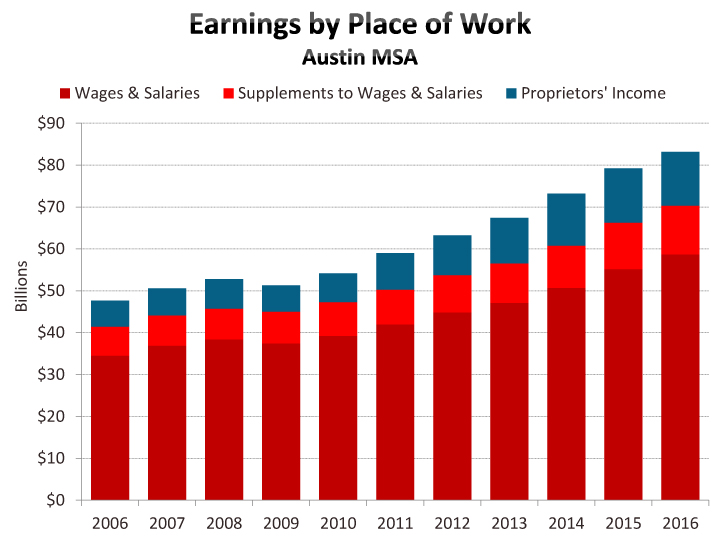
In 2016, Austin's total full- and part-time employment totaled 1,371,997, with 1,018,874 being wage and salary jobs, and 353,123 representing proprietors. Proprietors account for 26% of total jobs in 2016 in Austin, up from 23% ten years ago. For all U.S. metros, proprietors represent 22% of jobs, up from 19% ten years ago.
Relative to other metropolitan areas, Austin has seen strong gains in average earnings per job over the last five years. At $60,634 in 2016, earnings per job is up 14.9% over 2011, ranking ninth among major metros. However, over the last year, growth is 1.5%, better than the 0.9% growth for all metros, but 21st among major metros. In 2016, Austin’s average earnings per job exceed the metropolitan average for the first time since the early 2000s.

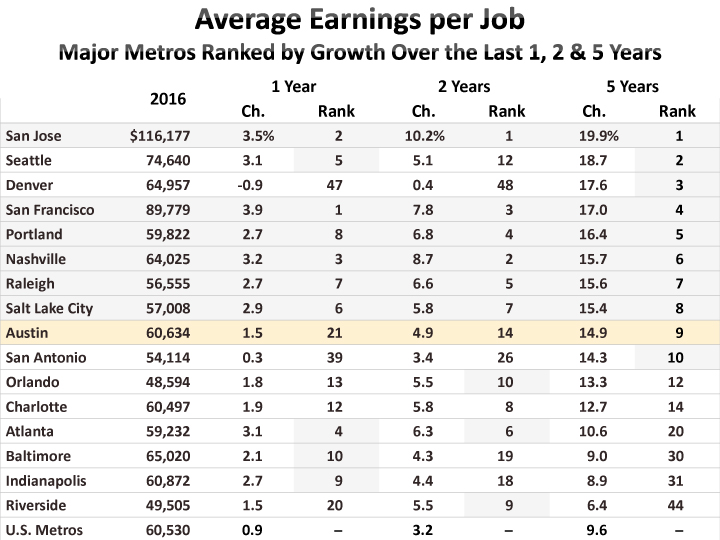
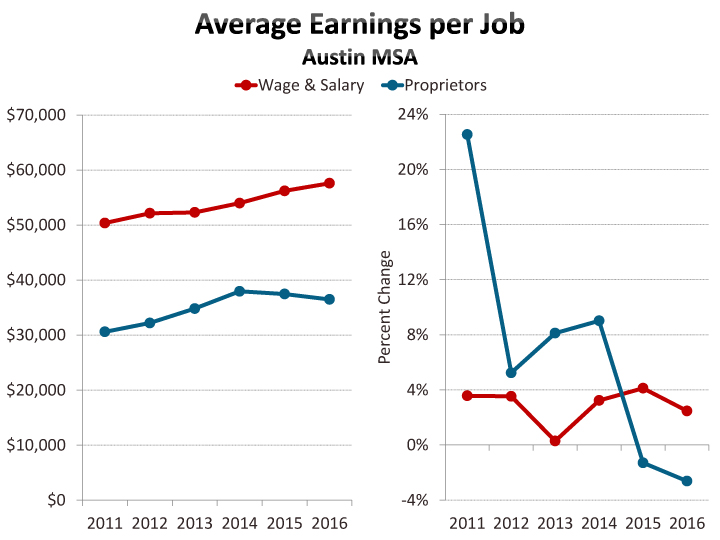
Austin’s most robust growth, over either the last year or the last five years, is in the growth of the average wage and salary per job. Austin average wage and salary per job is $57,610 in 2016, up 2.5% over the last year or 14.4% over the last five years. Among major metros, Austin has the sixth strongest growth over both the last year and the last five years. Average wage and salary in Austin has been higher than the metropolitan average since 2011.


With relatively robust average wage and salary growth in Austin, it is negative 2016 growth in proprietors’ income that weakened the performance of average earnings. Proprietors’ income represents a larger share of earnings by place of work in Austin (15.5% in 2016) than it does across all U.S. metros (11.6%). In Austin, total proprietors’ income and average proprietors income are both down in 2016, the former by 0.4% and the latter by 2.6%.

Beyond earnings, the other contributors to per capita personal income are personal current transfer receipts[3] and dividends, interest, and rent. Transfer receipts are about 10% of per capita income in Austin compared to 16% across all metros. This form of income increased by 1.6% per capita in Austin in 2016 compared to 2.4% across all metros.

Dividends, interest, and rent account for about 20% of per capita income in Austin and across all metros. This factor fell by 2.1% in Austin in 2016 (following 2.4% growth in 2015) while it grew by 0.3% across all metros (following 6.1% growth in 2015).

Local Area Personal Income and Employment data for metros and counties on the BEA's website begins in 1969. If you'd like to delve into this data, click here. Easy to create and export maps are also available. Many additional series related to the derivation of personal income are available which have not been treated above. Also, a wealth of industry detail for earnings, compensation, and employment is available.[4] Local area personal income definitions and methodologies are located here.
Note that this data is not adjusted for inflation. Inflation, as measured by the national price index for personal consumption expenditures, was 1.2% in 2016 and has also averaged 1.2% annually over the last five years. Later this year, the BEA will release real personal income data through 2016. That release will also include adjustments for the differences in price levels across geographic areas. [See our article here about the last release of real personal income.]
Additional graphs: Per Capita Personal Income and Average Earnings for Austin metro counties and major Texas metros.
FOOTNOTES:
[1] Personal income is the income received by, or on behalf of, all persons from all sources: from participation as laborers in production, from owning a home or unincorporated business, from the ownership of financial assets, and from government and business in the form of transfer receipts. It includes income from domestic sources as well as from the rest of the world. Personal income is the income that is available to persons for consumption expenditures, taxes, interest payments, transfer payments to governments and the rest of the world, or for saving.
[2] Proprietors’ employment consists of the number of sole proprietorships and the number of general partners. Proprietors’ income is the current-production income of sole proprietorships and partnerships and of tax-exempt cooperatives.
[3] Income maintenance benefits, unemployment insurance compensation, and retirement, medical and disability benefits.
[4] In round numbers, construction industry earnings increased from $6 billion in 2015 to $7 billion in 2016 in Austin. That amount is about a quarter of the year’s $4 billion increase in total earnings by place of work for Austin.
Related Categories: Central Texas Economy in Perspective