Real Personal Income, Metropolitan Price Parities & Inflation
Posted on 07/11/2017 by Beverly Kerr
- In 2015, Austin saw strong growth of 6.3% in real (price-adjusted) total personal income, an important, broad-based measure of the economy—Austin growth was seventh best among the 50 largest U.S. metros.
- Austin’s 3.2% real per capita personal income growth in 2015 lagged most major metros, however, growth over the last five years is 17.0% and only five large metros have seen faster growth.
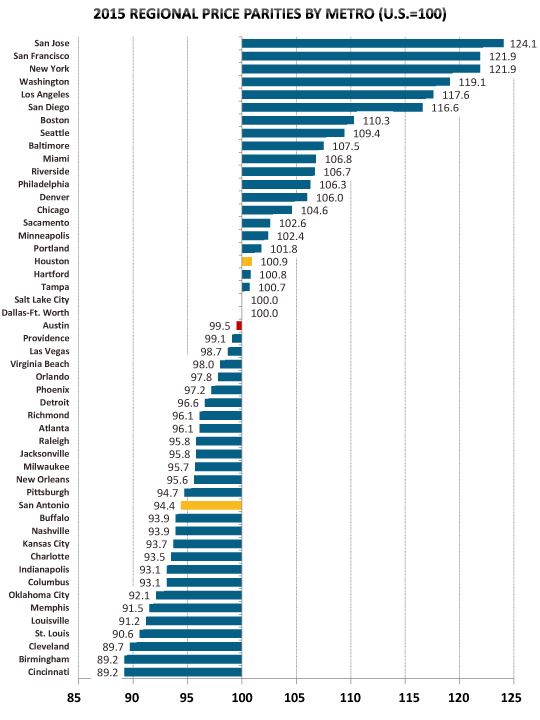
- Overall price levels in Austin are 0.5% lower than the U.S. average and also lower than Dallas-Ft. Worth and Houston.
- U.S. inflation was 0.3% in 2015. The rate was 0.7% for both Texas and Austin.
Real, price-adjusted estimates of personal income[1] for states and metropolitan areas for 2008-2015 were released by the U.S. Bureau of Economic Analysis in late June. Austin saw relatively strong real personal income growth in 2015 (6.3%), while Texas’ growth (3.8%) fell below the pace of growth nationally (4.1%). Austin’s 6.3% growth places it seventh among the 50 largest U.S. metros. San Antonio and Dallas-Fort Worth grew 5.4% (13th) and 5.2% (15th) respectively. Houston’s 3.1% growth places it 47th. Among major metros, the greatest gain was 8.0% in Nashville, followed by San Francisco and San Jose (both growing by more than 7%). No large metros had negative real personal income growth between 2014 and 2015.

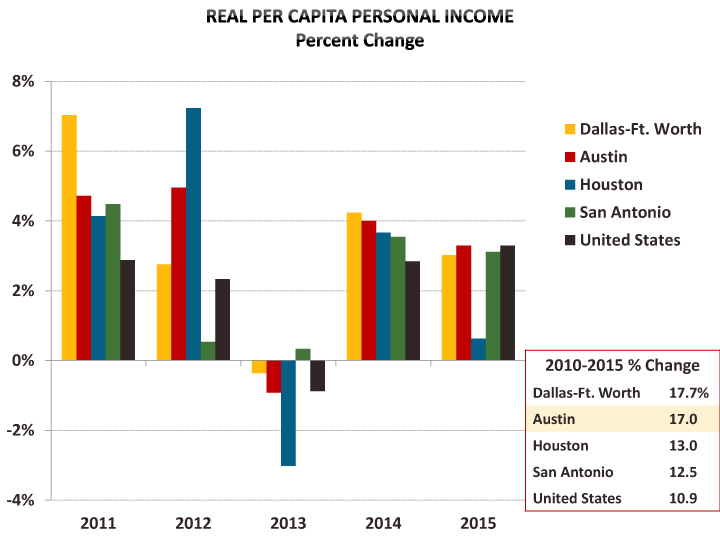
On a per capita basis, 2015 real personal income growth was 3.3% nationally. Texas’ real per capita personal income increased 1.9%. All of the 50 largest U.S. metros saw positive growth in 2015, ranging from 0.6% in Houston to 5.7% in San Jose. Among Texas major metros, Austin did best in 2015—3.2% (30th). The gain in San Antonio was 3.0% (35th) and Dallas-Fort Worth’s real per capita income increased 2.9% (39th).
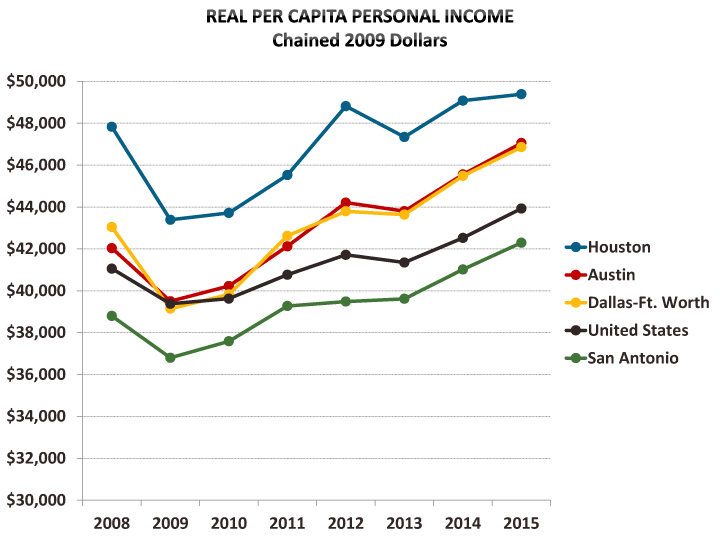
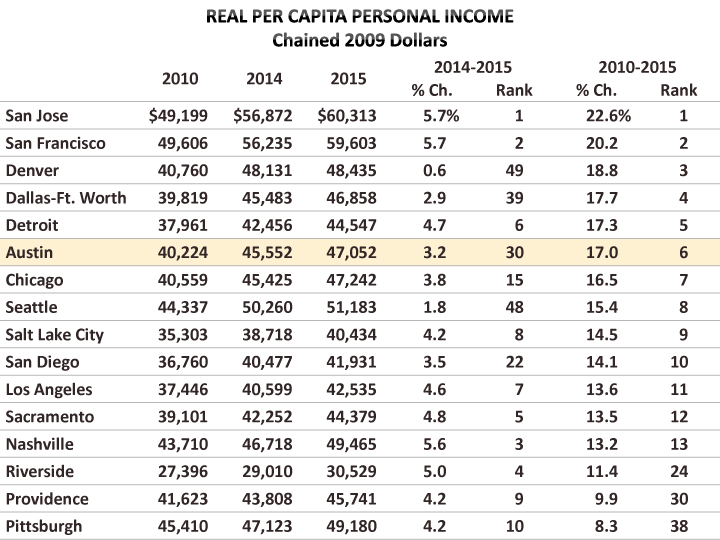
While Austin and the rest of the state appear to have had a lackluster 2015 on the basis of improvements in per capita income, Austin’s gains over the longer run are relatively robust. Real per capita income in Austin in 2015 is 17.0% above what it was in 2010—a rate of growth that ranks sixth among the top 50 metros. Dallas-Fort Worth ranks fourth for growth over the last five years, and Houston and San Antonio (15th and 18th respectively) also saw better growth than the national gain of 10.9%.
All of the 50 largest U.S. metros have positive growth over the last five years, however, three (Charlotte, Las Vegas, and Raleigh) have yet to regain the level of per capita personal income that they had before the impact of the recession. Nationally, real per capita income is 7.0% above what it was in 2008. Texas’ real per capita income is 8.2% above 2008, ranking 16th among the states. Both California (11.2%) and New York (10.9%) perform better (ranking fourth and fifth) over the period. Austin’s 2015 real per capita personal income is 11.9% higher than before the impact of the last recession and that growth ranks seventh among large metros.
This release of real personal income estimates is only the fourth official release of such statistics for metropolitan areas. Something that makes the data particularly innovative and valuable is that the data is not simply inflation-adjusted. The price-adjustments are based on both regional price parities (RPPs) and on BEA’s national Personal Consumption Expenditure (PCE) price index.
RPPs measure geographic differences in the price levels of consumption goods and services relative to the national average,[2] while the PCE price index measures national price changes over time. Using the RPPs in combination with the PCE price index allows for comparisons of the purchasing power of personal income across regions and over time.

According to the BEA, "Americans looking to move or take a job anywhere in the country can compare inflation-adjusted incomes across states and metropolitan areas to better understand how their personal income may be affected by a job change or move. Businesses considering relocating or establishing new plants also now have a comprehensive and consistent measure of differences in the cost of living and the purchasing power of consumers nationwide.”
Austin’s RPP in 2015 is 99.5, meaning that on average prices are 0.5% lower than the U.S. average. Austin’s nominal or current dollar per capita income is $51,014 in 2015 and Chicago’s is $53,886. If you divide Austin’s income by 0.995 and you divide Chicago’s by 1.046 (each metro’s RPP divided by 100), the RPP-adjusted per capita incomes are $51,270 and $51,516 respectively. That is, the purchasing power of the two incomes is nearly equivalent when adjusted by the areas’ differing price levels.
To create real, price-adjusted incomes for a region, current dollar income is divided by the region’s RPP and by the national PCE chain-type price index. The implicit regional price deflator (IRPD) will equal current dollar personal income divided by real personal income in chained dollars.
Thus, the BEA combines RPPs with the national PCE price index to create unique regional price indexes—IRPDs—for each metropolitan area. The growth rate or year-to-year change in the IRPDs is a measure of regional inflation.[3]

U.S. inflation was 0.3% in 2015. Among large metros, inflation ranged from -0.2% in Birmingham to 1.3% in Denver. Austin’s rate was 0.7%, and the statewide rate was also 0.7%. Austin’s 0.7% increase in prices ranked third highest among the 50 largest metros. Houston and Dallas-Ft. Worth (both 0.6%) also ranked in the top ten in 2015.
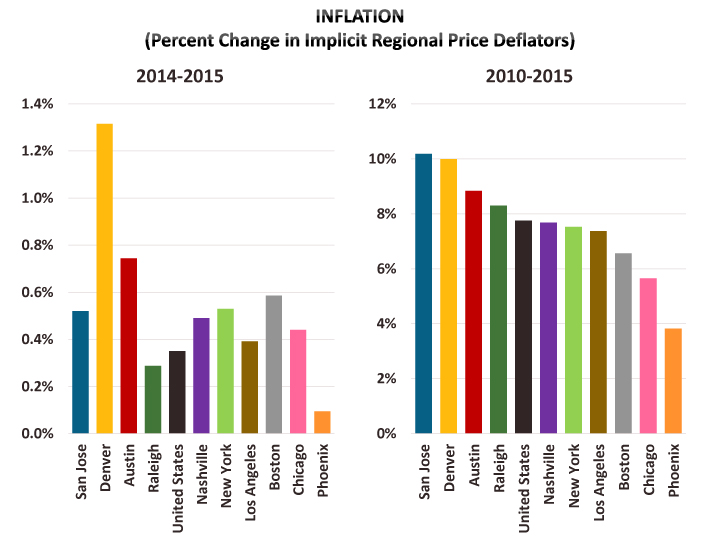
Over 2010-2015, prices increased a total of 8.8% in Austin, compared to the national increase of 7.8%. Austin’s increase ranked eighth highest among large metros. Dallas-Fort Worth, Houston and San Antonio had less inflation than Austin, 7.0%, 8.1% and 8.4% respectively. For inflation over the last five years, San Jose tops the ranking with 10.2% and Phoenix ranks 50th with a 3.8% increase.
Austin’s nominal or current dollar per capita personal income is $51,014 in 2015, which is 106% of the national per capita income ($48,112). In the real, price-adjusted series, Austin’s per capita personal income in chained 2009 dollars is $47,052, which is 107% of the national figure ($43,925). Among major metros, San Jose has the nation’s highest per capita income, both nominal and real. The current dollar per capita personal income for San Jose in 2015 is $81,592, which is 170% of the U.S. current dollar per capita income. However, in real, price-adjusted chained 2009 dollars, San Jose’s per capita income is $60,313 and only 137% of real U.S. per capita income.
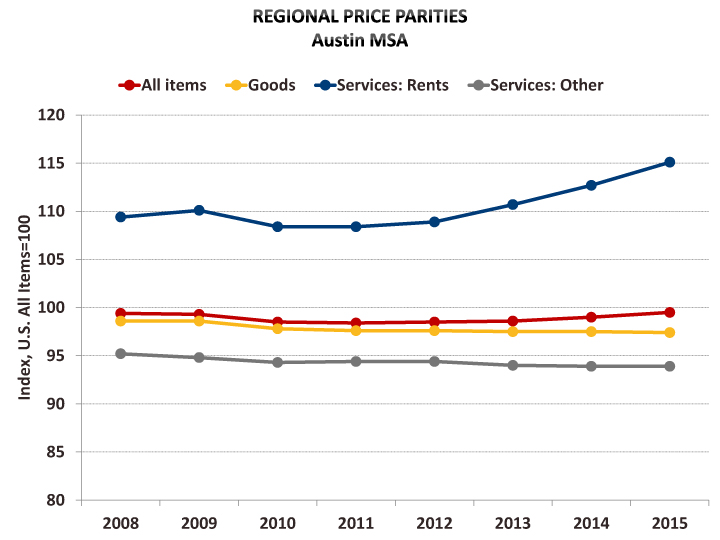
The RPP data made available by the BEA includes separate RPPs for consumption goods and for services, with services broken out into rents and other. Weighting is said to vary by year and is not included with the data, however the BEA notes that states with high (low) RPPs typically have high (low) price levels for rents. A BEA working paper indicates goods account for about one third and services for about two thirds of household expenditures, and that rents account for 29.5%.

Among large metropolitan areas, the All Items RPP ranges from 89.2 (Birmingham) to 124.1 (San Jose). Austin’s RPP of 99.5 is in the middle range of the distribution of the 50 largest U.S. metros (22 are higher and 27 are lower).
- Goods RPPs have a relatively narrow range of 93.0 (Cincinnati) to 109.7 (New York). Austin’s RPP for goods is 97.4, below the nation (99.4) and the metropolitan portion of Texas (97.5).
- Rents RPPs range from 69.2 (Birmingham) to 207.4 (San Jose). Austin’s RPP for rents is 115.1, above both the nation (101.7) and Texas metros (96.4).
- Other Services RPPs range from 89.7 (Cleveland) to 116.7 (New York). Austin’s RPP for other services is 93.9, below both the nation (100.0) and Texas metros (99.8).
FOOTNOTES:
[1] Personal income is the income received by all persons from all sources. Personal income is the sum of net earnings by place of residence, property income, and personal current transfer receipts.
[2] RPPs are calculated using price quotes for a wide array of items provided by the Bureau of Labor Statistics Consumer Price Index program, combined with data on rents from the Census Bureau's American Community Survey, with expenditure weighting constructed from the BLS Consumer Expenditure Survey and the BEA's Personal Consumption Expenditures.
[3] The U.S. Bureau of Labor Statistics produces metro area price deflators for a small number of large metros including Dallas and Houston, however, Austin has never been one of these.
Related Categories: Central Texas Economy in Perspective