Retail Trade Indicators
Posted on 06/07/2016 by Beverly Kerr
- Austin area retailers' sales totaled $34.25 billion in 2015, up 2.2% from 2014.
- City of Austin retail sales grew by 1.2% in 2015; sales in the remainder of the five-county metro grew by 3.3%.
- Sales of nonstore retailers grew faster than any other retailer group between 2014 Q4 and 2015 Q4.
- Total full-time and part-time jobs in retail grew by 2.7% while the value of payrolls grew 6.7% in 2015.
- Occupied retail real estate grew to over 102 million square feet in 2015, or 1.9%.
Sales by Austin area retailers totaled $34.25 billion in 2015 according to new data released last week by the Texas Comptroller of Public Accounts.

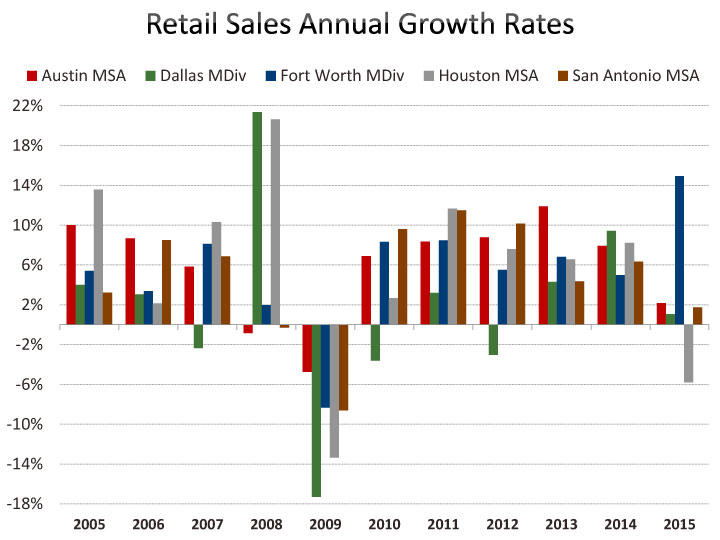
Growth over 2014 was 2.2%, a notable deceleration from the rates seen in the Austin metro over the preceding five years. Statewide, retail sales were down 0.2% in 2015. Houston, which accounts for fully a quarter of Texas' retail sales, saw sales decline by 5.8%. Sales increased 1.1% in Dallas and 1.7% in San Antonio, but jumped by 14.9% in Fort Worth. According to data from the Census Bureau, U.S. retail sales increased 1.6% in 2015, compared to 4.0% in 2014.

Diminished or slowing retail sales could have state and local fiscal impacts. However, retail sales subject to tax (about 40% of gross sales in the Austin metro) performed better than gross retail sales in 2015. Taxable sales were up 5.2% in the Austin metro and up 2.9% statewide. However, as with gross sales, those rates reflect a slowdown from the preceding several years.
Over half, 53.7%, of the metro's retail sales occur in the city of Austin, which saw sales increase by 1.2% in 2015. Round Rock retailers account for 11.8% of retail sales in 2015. The next two largest markets are San Marcos (5.0%) and Cedar Park (3.5%). Sales growth was 2.2% in Round Rock and 2.0% in Cedar Park in 2015. Sales declined by 0.9% in San Marcos. The balance of the 5-county metro saw retail sales increase by 4.2%.
The Comptroller's quarterly reports provide gross sales (and taxable sales) by type of retailer.[1] The following two graphs illustrate fourth quarter 2015 sales and percent change in sales by store type for Austin and the state.


Other indicators of the performance and composition of the local retail trade sector are provided by data on firms, establishments, jobs and payrolls in the Quarterly Census of Employment and Wages (QCEW), produced by the Texas Workforce Commission. QCEW recently released the final quarter of 2015.

Total full-time and part-time jobs on retail payrolls averaged 99,241 in 2015, 2.7% over 2014's metro area average. As with sales, job creation has slowed from the rates attained in the preceding several years. Total retail payrolls, at $3.3 billion, are up 6.7% from 2014, but that rate of growth is lower than three of the preceding four years.
QCEW also provides detail by store type and the graph below illustrates the distribution of jobs and establishments by store type in Austin.

As the "Retail Sales Growth Rates by Store Type" graph above showed, nonstore retailers saw greatest increase in sales between 2014 Q4 and 2015 Q4—32.7%. QCEW data shows the group ahead of all others for growth in number of establishments (11.5%) and also one of the stronger types for rate of job creation (14.6%) and payroll growth (17.4%). The sport/hobby/books group grew jobs (21.2%) and payrolls (22.1%) faster than all other store types, however, 2015 Q4 sales are up a moderate 3.4% over 2014 Q4.

It should be noted that while QCEW has the virtue of providing an essentially comprehensive representation of employer businesses, it does not represent the universe of sales tax filers represented in the Comptroller's data. QCEW represents about 5,400 retail establishments with unemployment insurance-covered payrolls in the Austin metro, while the Comptroller data comes from holders of sales tax permits. In the Austin metro, roughly 18,000 to 24,000 retail "outlets" filed reports quarterly or annually in 2015.

A third indicator of retail sector growth can be obtained from the commercial real estate market. CoStar Realty Information, shows that occupied retail real estate in the five-county Austin metro grew by 1.9% to over 102 million square feet in 2015. During 2015, almost 1.9 million square feet was absorbed. With vacancy at a low 3.6%, or 3.9 million square feet, continued retail growth, even at the moderate pace of 2015, could absorb existing inventory in a very short time. Reporting indicates only about 620,000 SF of retail space is presently under construction.

Comptroller Links:
Time series of retail sales (and sales for other industries):https://mycpa.cpa.state.tx.us/allocation/HistSales.jsp
Quarterly analysis reports with detail by store type:
http://comptroller.texas.gov/taxinfo/staxqtr/
The Chamber’s Economic Indicators:
Excel files containing a wide array of time series data are updated monthly. Coverage includes retail sales and sales tax allocation data from the Comptroller, alternative retail sales data from the Federal Reserve Bank of Dallas, as well as data on the retail real estate market. The QCEW retail industry data treated above is not included in our Economic Indicators files, however, an alternative retail trade industry employment series from the Current Employment Statistics program is included.
Footnotes:
(1) North American Industry Classification System (NAICS) classifies the retail trade sector into the following divisions:
441: Motor vehicle & parts dealers
442: Furniture & home furnishings stores
443: Electronics & Appliance Stores
444: Building material & garden supply stores
445: Food & beverage stores
446: Health & personal care stores
447: Gasoline stations
448: Clothing & clothing accessories stores
451: Sporting goods, hobby, book, & music stores
452: General merchandise stores
453: Miscellaneous store retailers
454: Nonstore retailers
The NAICS page linked to above, will provide definitions and examples for the types of stores included in each of the above classifications.
Related Categories: Central Texas Economy in Perspective