Personal Income
Posted on 12/04/2018 by Beverly Kerr
- Total personal income in the Austin metro grew by 6.4% in 2017, the 5th fastest growth rate among major metros.
- Per capita personal income is $54,817 in Austin, 2.2% above that of the metropolitan portion of the U.S. Over the last year, per capita personal income grew 3.6% in Austin, compared to 3.7% for all metros.
- Average wages and salaries per job is $60,142 in 2017, up 4.4% over 2016. Among major metros, Austin ranks 4th for growth over the last year.
Personal income totaled $116.0 billion in the five-county Austin metropolitan area in 2017 according to the latest annual release by the U.S. Bureau of Economic Analysis (BEA) of personal income data for metropolitan areas and counties. Austin’s total personal income rose 6.4% in 2017. Growth was 5.4% in 2016. Personal income is the broadest measure of local economic activity available,[1] with the exception of gross domestic product by metro.

All but six of the nation's 383 metropolitan areas saw personal income growth in 2017. In aggregate, growth was 4.5% for the metropolitan portion of the U.S., up from 2.8% in 2016. Growth ranged from -4.0% in Enid, OK to 16.6% in Midland, TX.
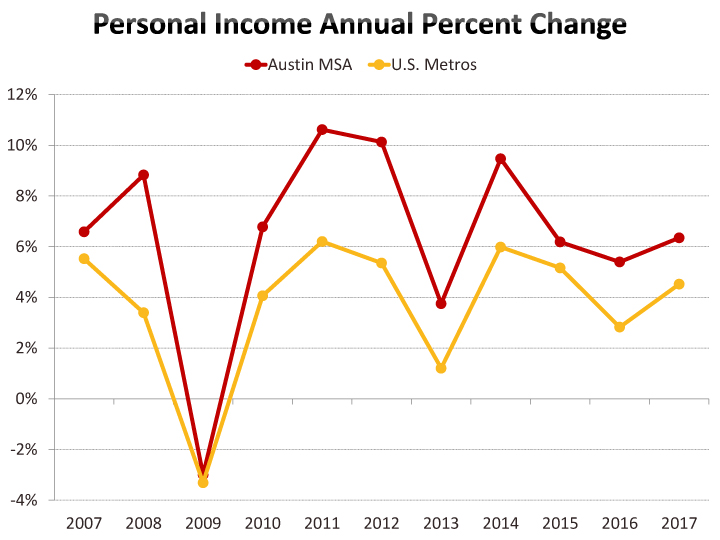
Austin’s 6.4% growth in personal income from 2016 to 2017, was the fifth fastest rate of growth among the 50 largest metros. San Jose’s 6.7% growth was the highest. The slowest growth among large metros was 2.5% in Hartford, CT. Within the Austin metro, growth ranged from 6.0% in Travis County to 7.7% in Hays County. Texas’ growth was 4.1%, up from 0.4% in 2016.

Austin's personal income growth over the last five years is 35.2%, better than all but two of the 50 largest metros and substantially above the 21.2% growth for metropolitan portion of the U.S. San Jose’s growth over the last five years is 41.9% and San Francisco’s is 37.7%.
Austin's robust population growth and job growth (among large metros, Austin is No. 1 for growth in both measures over the last five years) would be expected to drive relatively strong aggregate personal income and earnings growth. Therefore, growth in per capita income and in earnings per job would be measures to look to for an indication of relative improvements in Austin’s standard of living.
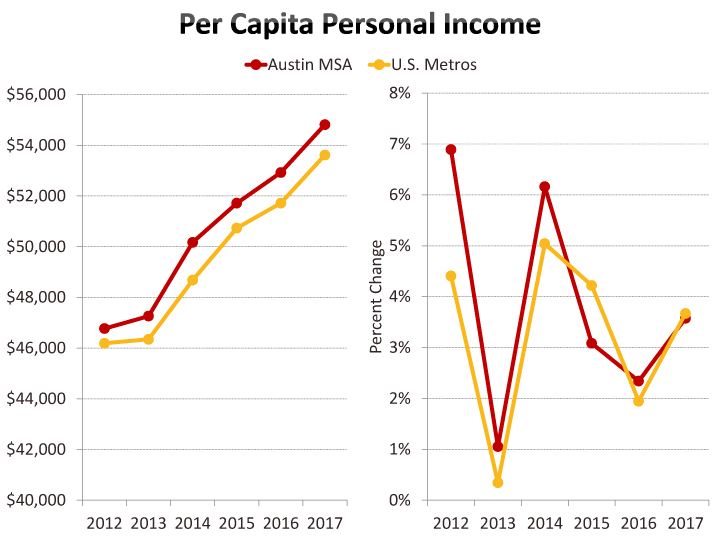
In 2017, per capita personal income is $54,817 in Austin, 2.2% above that of the metropolitan portion of the U.S. Austin’s per capita personal income has exceeded the metro average for the last six years. Prior to 2003, Austin had higher per capita income than the metro average (the current version of this BEA data begins in 2001). Among the top 50 metros, Austin ranks 16th for per capita personal income.

Austin’s per capita income growth over the last year was 3.6%, compared to 3.7% for all metros, and Austin ranked 24th among large metros. Over the last five years, growth was 17.2%, leading metro U.S. growth of 16.1%, and Austin ranked 19th.

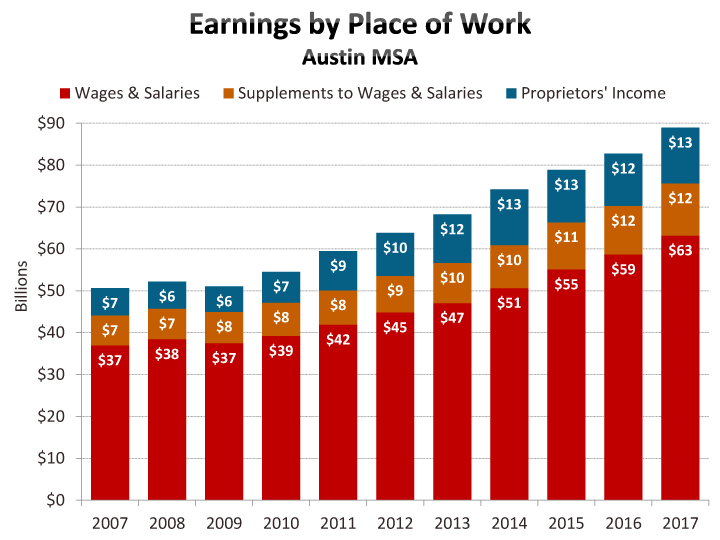
Other measures produced by the BEA’s local area personal income estimates include earnings by place of work, a measure comprising earnings of both wage and salary workers and proprietors;[2] compensation of employees, a measure of total compensation to wage and salary workers (i.e., wages and salaries, plus employer contributions for pensions, insurance funds, and government social insurance programs). Wage and salary employment and proprietors employment are available, as are average compensation and earnings per job.

In 2017, Austin's total full- and part-time employment totaled 1,422,990, with 1,050,587 being wage and salary jobs, and 372,403 representing proprietors. Proprietors account for 26% of total jobs in 2017 in Austin, up from 24% ten years ago. For all U.S. metros, proprietors represent 22% of jobs, up from 20% ten years ago.

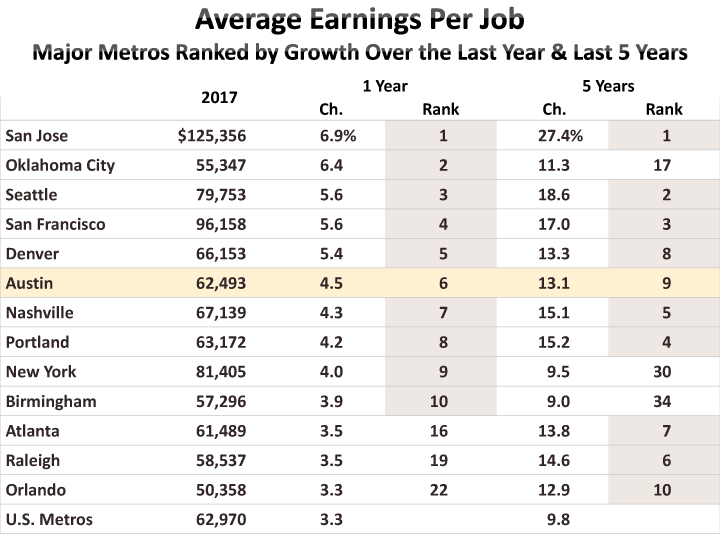
Relative to other metropolitan areas, Austin has seen strong gains in average earnings per job over the last year. At $62,493 in 2017, earnings per job is up 4.5% over 2016, ranking sixth among major metros. Over the last five years, growth is 13.1%, which ranks ninth among major metros. Average earnings per job for all metros is $64,970, 0.8% higher than in Austin.


Average compensation of employees (wages and salaries plus supplement to wages and salaries) was $71,986 in Austin in 2017, 1.8% higher than the metro areas average of $70,697. Austin’s average compensation per job was the 19th highest among the top 50 metros. Austin’s average compensation increased 2.0% over the last year (ranking 11th among major metros) and 14.5% over the last five years (ranking 4th).


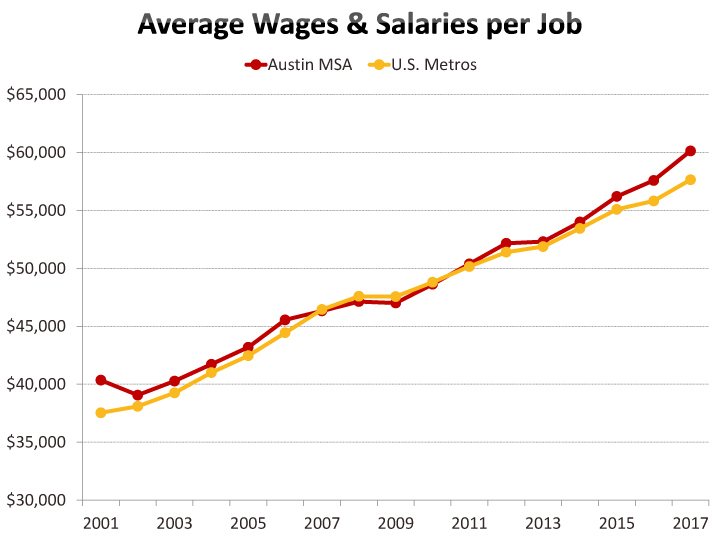
Austin average wage and salary per job is $60,142 in 2017, up 4.4% over the last year or 15.3% over the last five years. Among major metros, Austin has the fourth strongest growth over both the last year and the sixth strongest over last five years. Average wage and salary per job in Austin has been higher than the metropolitan average since 2011.

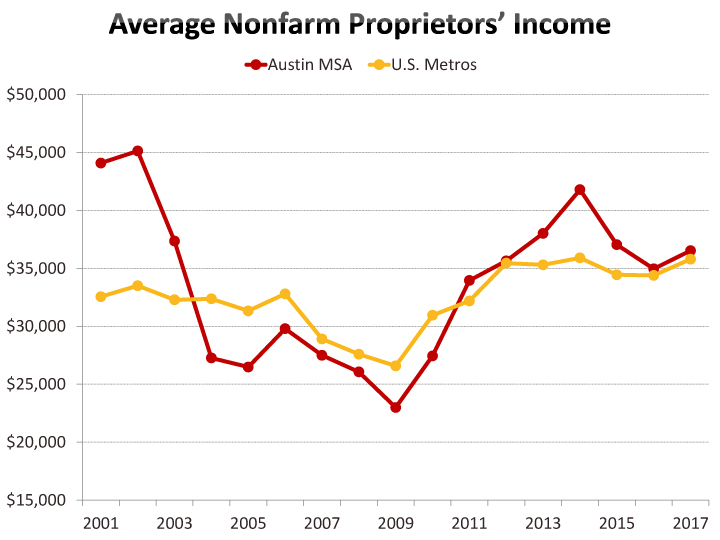
Average nonfarm proprietors’ income was $36,535 in Austin in 2017, compared to $35,797 for all metros. Proprietors’ income represents a larger share of earnings by place of work in Austin (15.0% in 2017) than it does across all U.S. metros (12.5%). Average proprietors' income is up by 4.5% in Austin and 4.1% across all metros in 2017. However, the differences from five years ago are slighter—Austin’s average is up 2.5% and all metros are up 1.0%.

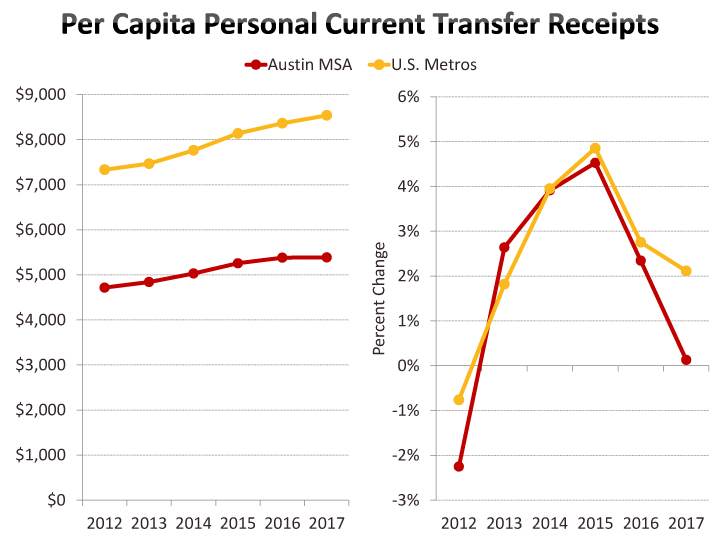
Beyond earnings, the other contributors to personal income are personal current transfer receipts[3] and dividends, interest, and rent. Transfer receipts are about 10% of personal income in Austin compared to 16% across all metros. This form of income increased by 0.1% per capita in Austin in 2017 compared to 2.1% across all metros. At $5,388 in 2017, per capita personal current transfer receipts are lower in Austin than in any other major metro area.
Dividends, interest, and rent account for about 21% of per capita income in Austin and 20% across all metros. This factor increased 2.2% in Austin in 2017 (following 5.2% growth in 2016), while it grew by 3.9% across all metros (following 2.0% growth in 2016). Austin’s 2.2% growth in 2017 ranked 49th among major metros and its 13.4% growth over the last five years ranked 41st.

Local Area Personal Income and Employment data for metros and counties on the BEA's website begins in 2001.[4] If you'd like to delve into this data, click here. Easy-to-create exportable maps are also available. Many additional series related to the derivation of personal income are available which have not been treated above. Also, a wealth of industry detail for earnings, compensation, and employment is available. Local area personal income definitions and methodologies are located here.
Note that this data is not adjusted for inflation. Inflation, as measured by the national price index for personal consumption expenditures, was 1.8% in 2017 and has averaged 1.2% annually over the last five years. Later this year, the BEA will release real personal income data through 2017. That release will also include adjustments for the differences in price levels across geographic areas.
- Additional graphs: Major Texas metros compared.
- Maps: Illustrating levels & growth for several variables.
FOOTNOTES:
[1] Personal income is the income received by, or on behalf of, all persons from all sources: from participation as laborers in production, from owning a home or unincorporated business, from the ownership of financial assets, and from government and business in the form of transfer receipts. It includes income from domestic sources as well as from the rest of the world. Personal income is the income that is available to persons for consumption expenditures, taxes, interest payments, transfer payments to governments and the rest of the world, or for saving.
[2] Proprietors’ employment consists of the number of sole proprietorships and the number of general partners. Proprietors’ income is the current-production income of sole proprietorships and partnerships and of tax-exempt cooperatives.
[3] Income maintenance benefits, unemployment insurance compensation, and retirement, medical and disability benefits.
[4] As of last year’s local area personal income and employment release, data on the website began in 1969. The interactive data access tool no longer presents data before 2001 for counties and metropolitan areas. However, zip files of archived regional accounts tables are available that may still provide data before 2001. If so, users may see a transition in joining the old series to the current series, which is revised back to 2001.
Related Categories: Central Texas Economy in Perspective