Job growth & unemployment
Posted on 11/19/2019 by Beverly Kerr
- Austin added 39,607 net new jobs, growth of 3.7%, in the 12 months ending in October, making Austin the fastest growing Texas metro.
- Information grew by 14.8% (4,954 jobs), making it Austin’s fastest growing industry, while professional and business services added the most jobs, 9,185 (or 4.8%), over the last 12 months.
- Austin's seasonally adjusted unemployment rate is 2.7%, unchanged from September.
Nonfarm payroll jobs
The Austin metropolitan area added 39,607 net new jobs, or 3.7%, in the 12 months ending in October, according to Friday's releases of preliminary payroll jobs numbers by the Federal Reserve Bank of Dallas. (See a SIDEBAR at the bottom of this page for comments about the Current Employment Statistics data from the Texas Workforce Commission and U.S. Bureau of Labor Statistics that the Dallas Fed uses to produce these estimates.)

Austin’s 3.7% growth makes it the best performing among Texas’ 10 largest metro areas. McAllen was the next fastest with 2.6% growth.

For the year ending in October, private sector growth in the Austin MSA is 4.1%, or 37,261 jobs, with all private industry divisions, but one, adding jobs. Austin's sizable government sector (17% of jobs) grew by only 2,346 jobs or 1.3%, thus bringing the overall growth rate to 3.7%.

Texas saw net private sector job growth of 2.4% with all private industries adding jobs over the last 12 months. Total job growth was 2.2% as the government sector, which accounts for nearly 16% of total state employment, saw slight growth (0.7%). For the nation, private sector growth is 1.5% for the 12 months ending in October with all private industries, but one, adding jobs. Overall job growth is a more modest 1.4% because of minor (0.7%) government sector growth.

Seasonally adjusted jobs for October are up from September by 5,700 jobs or 0.5% in Austin. October jobs are also up from September by 0.9% in San Antonio and 0.1% in Houston, while down in Dallas and Fort Worth, by -0.1% and -0.2% respectively. Statewide, seasonally adjusted jobs are up by 26,173 or 0.1%. Jobs are also up from September by 0.1% nationally.

In Austin, professional and business services added the most jobs, 9,185 (4.8%), over the last 12 months. The fastest growing industry was information which grew by 14.8% or 4,954 jobs. Also growing at faster-than-average rates are transportation, warehousing and utilities (8.2% or 1,841), leisure and hospitality (6.4% or 8,383); construction and natural resources (6.4% or 4,092); other services (6.0% or 2,801); and manufacturing (4.4% or 2,673). Education and health services jobs fell by 426 or 0.3%.

Statewide, construction and natural resources grew fastest, by 4.6%, adding 46,360 jobs over the last 12 months. Education and health services added the most jobs, 46,969, and grew by 2.7%. Other relatively fast growing industries included transportation, warehousing and utilities (3.6%) and financial activities (3.5%).
Nationally, education and health services grew fastest, adding 2.7% over the 12 months ending in October. Professional and business services (1.9%); leisure and hospitality (2.4%); and construction and natural resources (1.8%) were also relatively fast growing. Information and retail trade lost jobs (0.4% and 0.1% respectively).

The net gain for private service-providing industries in Austin is 30,496 jobs, or 3.9%, over the last 12 months. Employment in goods producing industries is up by 6,765 jobs or 5.4%. Statewide, private service-providing industries are up 194,966, or 2.2%, and goods producing industries are up 65,761 jobs, or 4.6%.
Labor force, employment & unemployment
We also now have October labor force, employment, and unemployment numbers for Texas and local areas in Texas. The same data for all U.S. metros will not be released until November 27. In September, Austin had the eleventh lowest rate of unemployment among the 50 largest metros (San Francisco, San Jose and Denver had the lowest rates).
Unemployment numbers for October show Austin’s performance relative to the state and other major Texas metros being sustained. In October, Austin’s seasonally adjusted rate is at 2.7%, while the other major metros range from 3.0% in San Antonio to 3.7% in Houston. Dallas and Fort Worth are at 3.2% and 3.3% respectively. Austin’s and San Antonio’s rate are unchanged from September, while rates in the other major Texas metros are each one tenth of a percentage point higher. The state’s seasonally adjusted rate is 3.4%, unchanged from September. Nationally, unemployed increased from 3.5% in September to 3.6% in October.

Austin’s rate one year ago was 2.8%. The statewide seasonally-adjusted rate is now 3.4%, down from 3.7% in October of last year. The national unemployment rate is 3.6%, improved from 3.8% a year ago.
Within the Austin MSA, Travis County has the lowest unemployment rate in October, at 2.4%, while Caldwell County has the highest at 3.1%. The rate is 2.7% in Williamson and Hays Counties and 2.9% in Bastrop County. Note that county rates are not seasonally adjusted.
Seasonally adjusted unemployment rates for Texas metros are produced by the Federal Reserve Bank of Dallas. (The TWC also produces seasonally adjusted rates for Texas metros, but publication lags the Dallas Fed’s data.)

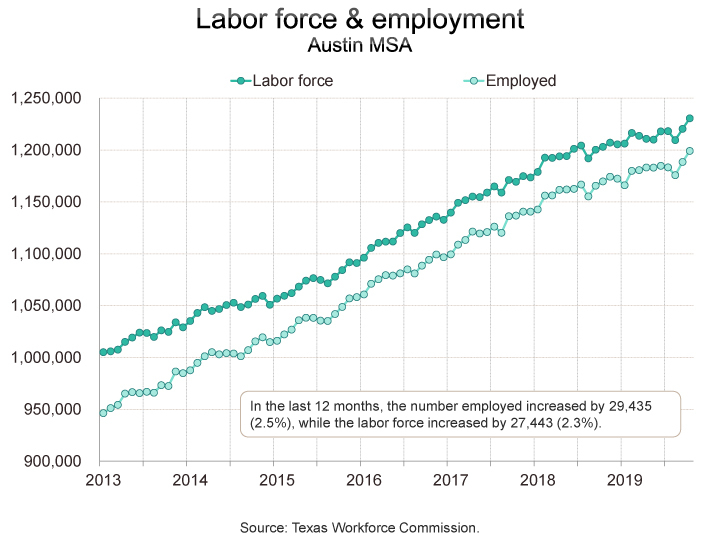
With Austin’s unemployment rate down from one year ago, the number unemployed has also fallen. In October 2018, Austin’s number of unemployed was 33,376. Over the last 12 months, the unemployed declined by 1,992 or 6.0%, to 31,384. This is due to a larger increase in the number employed, compared to labor force. The Austin metro’s civilian labor force (employed plus unemployed) increased by 27,443 persons or 2.3% from one year ago, while persons employed increased by 29,435 or 2.5%.

Texas’ employment growth (309,216 or 2.3%) also exceeds labor force growth (288,003 or 2.1%). Thus, the number of unemployed decreased by 21,213 or 4.3%. Nationally, October civilian labor force is up by 1.9 million or 1.1%, while employed is above the level of a year ago by 2.1 million or 1.3%, and 261,000 fewer people (4.5%) are unemployed.


November estimates will be released on December 20.
The Chamber’s Economic Indicators page provides up-to-date historical spreadsheet versions of Austin, Texas and U.S. data for both the Current Employment Statistics (CES) and Local Area Unemployment Statistics (LAUS) data addressed above.
Sidebar ↩
This monthly article on new labor market data customarily relies on the Current Employment Statistics (CES) data as released by the Texas Workforce Commission and the U.S. Bureau of Labor Statistics. This month we are electing to focus on the version of this data produced by the Federal Reserve Bank of Dallas.
As we’ve noted in the last several monthly articles about the CES data, when we see atypical growth rates in Austin’s nonfarm payroll jobs data, we sometimes look at an alternative payroll jobs dataset, the Quarterly Census of Employment and Wages (QCEW) to see how consistent the two datasets appear. QCEW, which is derived from the universe of unemployment insurance-covered employer payroll records, informs the annual benchmark revisions to the sample-survey-based CES data. QCEW data, which, as of last Friday, is now available through June 2019, gives some evidence that Austin’s recent job growth may be more robust than preliminary CES data indicates.

The Federal Reserve Bank of Dallas produces a version of nonfarm payroll jobs that benchmarks to QCEW data quarterly instead of annually. The Dallas Fed’s early-benchmarked and seasonally adjusted data indicates that Austin’s job growth for the year ending in October is 3.7%. In contrast, BLS/TWC data, which is benchmarked to QCEW through the third quarter of 2018, provides a growth estimate of 2.5% for the year ending October.

While most media reporting on the labor market relies on the BLS/TWC CES data, it can be helpful to be aware of limitations of the sample survey at the local level and the potential for actual growth to be higher or lower than preliminary estimates indicate. Many types of investment decisions—residential or commercial construction, for example—are made based on a market’s current job growth performance, so it can be unfortunate to misidentify market conditions.
As a relatively fast growing metro, it may be that the sample survey of employers in our area sometimes becomes insufficiently representative. With unemployment as low as it has been in Austin over the last couple of years, and for other reasons, such as a probable decrease in migration due to similarly low unemployment rates elsewhere, it is reasonable to expect Austin’s job growth to slow, but with the divergence between CES and QCEW data we see in the last quarter of 2018 and the first half of 2019, there is a basis to question if growth is currently quite as low as 2.5%.

Note that the Excel file of nonfarm payroll jobs time series data on the Chamber’s Economic Indicators page includes not only the CES data (total, private, and major industry sectors), but also the QCEW series (total and private industry), and the seasonally adjusted and early-benchmarked Dallas Fed series (total).