Entrepreneurship
Posted on 11/06/2018 by Beverly Kerr
- Startups account for a larger share of businesses in Austin than in nearly all major U.S. metros in 2016.
- Women-owned firms represent 22.8% of Austin businesses with paid employees and the number of women-owned firms increased 11.5% in the last year.
- Minority entrepreneurs make up 18.2% and veteran entrepreneurs represent 6.6% of Austin area employer firms.
- Austin ranks fourth among the top 50 metros for firms receiving significant funding from outside investors in 2016.
YEARS IN BUSINESS
Young firms account for a larger share of businesses in Austin than in nearly all other major U.S. metros. Of the 38,405 firms in Austin in 2016 with paid employees, 11.6% (4,444) have been in business less than two years, 28.1% (10,807) have been in business less than four years, and 39.3% (15,077) have been in business less than six years. As the table below shows, Austin ranks third for the share of firms in business less than two years and second for share of firms less than four or six years. Las Vegas ranks first across all three young firm age ranges.

Nationally, 9.2% of firms with paid employees have been in business less than two years, 23.0% have been in business less than four years, and 32.9% have been in business less than six years.
This data comes from the recent third release the U.S. Census Bureau's Annual Survey of Entrepreneurs (ASE) that was introduced as a supplement to the Survey of Business Owners, which is conducted every five years. This annual survey provides a timely and more frequent socioeconomic portrait of employer businesses by gender, race, ethnicity, and veteran status. This annual survey introduced a new dimension, years a firm has been in business, not found in the Survey of Business Owners. New annual data on job-creating startups and other employer firms will be a boon to understanding the economy. Since much of the survey’s data is available for the 50 most populous metropolitan areas, it also brings actionable insights to local policy makers seeking to foster successful entrepreneurial climates and support underrepresented groups.[1]

The majority, 67.6%, of Austin’s paid employees work for the 27.7% of area firms that have been in business 16 or more years. Nationally, 75.3% of employees work for the 34.0% of firms in business 16 or more years.

Only about 3.1% of the 761,500 paid employees of private firms in Austin work for firms that have been in business less than two years. Firms that have been in business less than six years employ 13.7% of the area’s paid employees. Nationally, 2.1% of employees work for the youngest firms and 9.6% work for firms in business less than six years.
New Austin firms, those less than two years old, employ 23,330. Among these firms, the industry responsible for creating the most jobs is accommodation and food services. The 459 youngest firms in this industry employ 6,552 workers or 28.1% of jobs at new firms. The other industries with most significant job creation by new firms are construction (4,093 employees), healthcare and social assistance (2,500-4,999 employees), and other services (2,500-4,999 employees). (For some industries, data suppression for confidentiality means that employment ranges are substituted for specific estimates.)
Nationally, the top industry for jobs at firms in business for less than two years is professional, scientific and technical services (14.3%), followed by accommodation and food services industry (12.0%) and retail trade (11.8%).

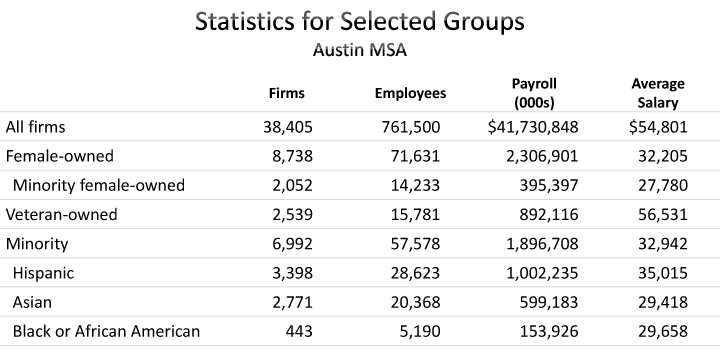
SELECTED GROUPS
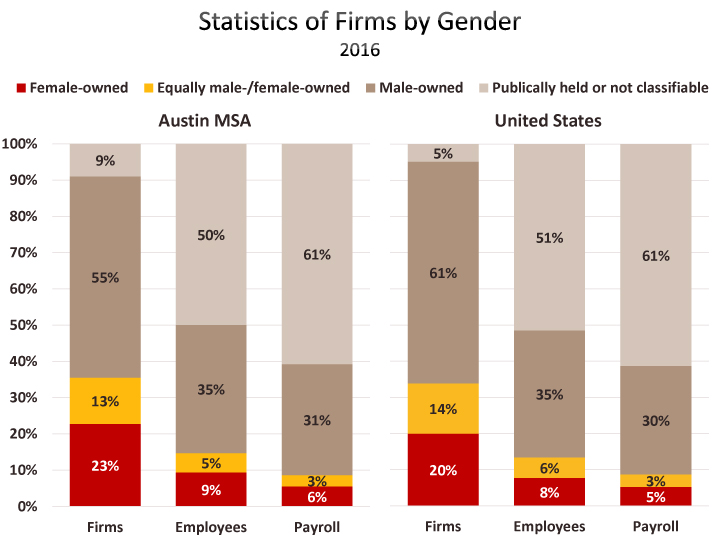
In Austin, 8,738, or 22.8%, of employer firms are female-owned, compared to 20.0% nationally. The number of women-owned firms in Austin increased by 11.5% over 2015. Nationally, women-owned firms increased by 2.8%. Male-owned firms account for 55.5% of firms in Austin and 61.3% nationally. Women-owned firms account for 9.4% of employees and 5.5% of payrolls in Austin, while women-owned firms account for 7.7% of employees and 5.2% of payrolls nationally. Among the 50 largest metros, Austin ranks sixth for percentages of female-owned firms and employees working for female-owned firms.

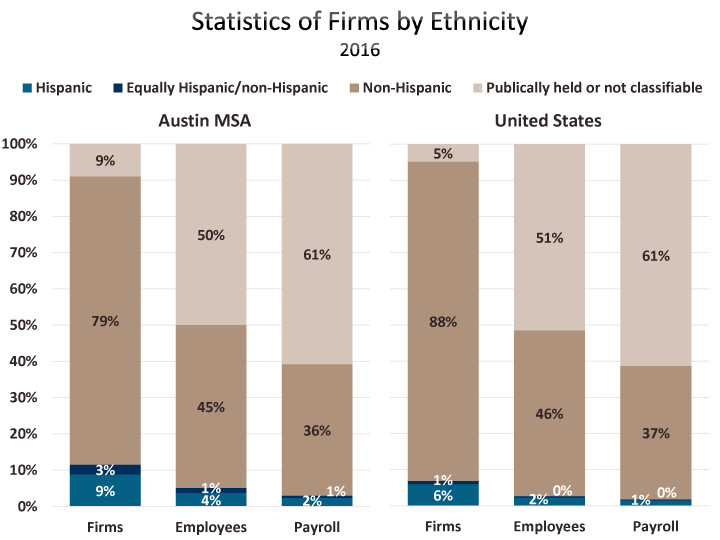
The rate of minority ownership of employer firms in Austin (18.2%) is similar to the national rate (18.8%), while nonminority (i.e., non-Hispanic white population) ownership is lower in Austin (69.7%) than applies nationally (74.9%), due to higher shares in Austin of equally minority/nonminority-owned firms and publically held or non-classifiable firms. The number of minority-owned firms increased 10.2% in Austin in 2016, compared to 5.9% nationally.

Hispanics, which make up 30.2% of Austin’s labor force in 2016, account for 8.8% of employer firms. Hispanics account for 16.9% of the U.S. labor force and 6.0% of all firm owners. Of the 3,398 Hispanic-owned firms in Austin, 596 (17.5%) are in construction and 536 (15.8%) are in professional, scientific and technical services. Nationally, the two most significant industries are construction and accommodation and food services, accounting for 14.8% and 12.9% of Hispanic-owned businesses, respectively. In Austin, 3.8% of the private sector workforce is employed by Hispanic-owned firms, compared to 2.3% nationally.
Nationally, veterans own 7.8% of employer firms. In Austin, veterans own 2,539 firms or 6.6% of all firms (the rate is boosted to 9.3% if firms that are equally veteran-/nonveteran-owned are included). Professional, scientific, and technical services account for 21.4% of veteran-owned firms in Austin, nearly the same share (21.6%) that the industry accounts for among all firms. Veterans are notably more represented in finance and insurance, which account for 7.8% of veteran-owned firms compared to 4.6% for all firms. Veterans are also more concentrated in retail trade (15.1%) than firm owners overall (9.7%).

NUMBER OF EMPLOYEES
Austin’s 38,405 firms with paid employees are distributed across the size classes indicated in the table below. Note that firm size employment categories in ASE tabulations are based on the nationwide employment of the firm, not the employment of the local establishment of that firm.
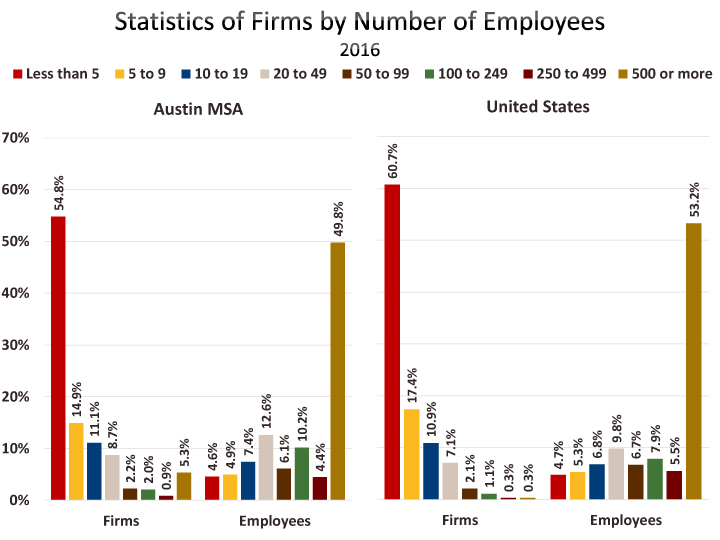
The majority of the 2,050 large firms in Austin, those with 500 or more employees, are concentrated in retail trade (452 firms); finance and insurance (311); professional, scientific, and technical services (292); and wholesale trade (237). Half of Austin’s private employees work for large firms. The majority Austin’s jobs at large firms are are in retail trade (72,826 employees); healthcare and social assistance (50,956); leisure and hospitality (49,079); and professional, scientific, and technical services (46,247).
In Austin, salaries at large firms are 16.0% higher than the average for all firms ($54,801 for all firms and $63,550 for firms with 500 or more employees). In professional, scientific, and technical services Austin’s average salary is $119,660 at the largest firms, 29.6% higher than pay in the industry overall firm sizes. In wholesale trade, the average salary at large firms is $118,407, 19.3% over the industry average.

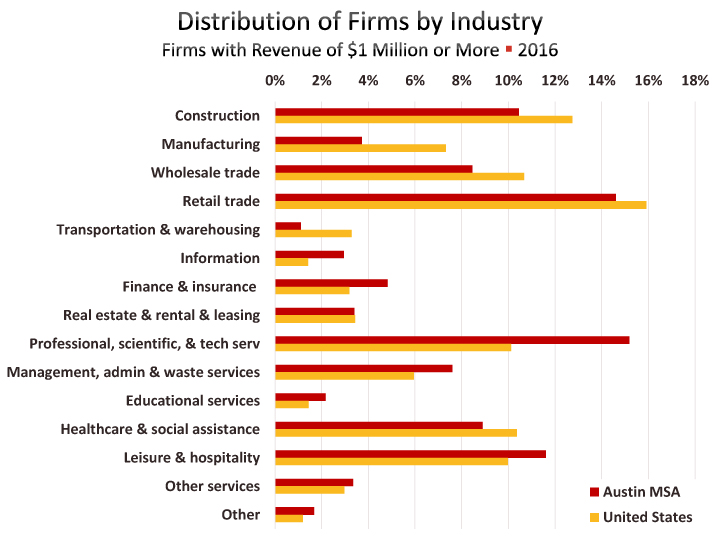
REVENUE
In Austin, 14,145 firms or 36.8% have revenues of $1,000,000 or more. These firms employ 89.8% of workers and expend 94.5% of area payrolls. Nationally, only 26.7% of firms are in this revenue class, but these firms account for percentages of employees (88.2%) and payrolls (94.0%) similar to Austin.


OTHER CHARACTERISTICS OF BUSINESSES & BUSINESS OWNERS
The preceding paragraphs are drawn from the ASE’s four “company summary” tables that provide data by industry, gender, ethnicity, race, veteran status, years in business, receipts size of firm, and employment size of firm. Another 50 ASE tables provide firms, employees, and payrolls by characteristics of the business (38 tables) and characteristics of the business owner (12 tables) for the 50 largest metro areas. The following findings is just a partial representation of the topics available (relying on only about 17 of the 50 tables).
- In Austin, 1.1% of firms received funding from outside investors of $250,000 or more in 2016. This rate ranks fourth among the top 50 metros.
- Austin ranks 13th for the percentage of business that say they are profitable (67.6%).
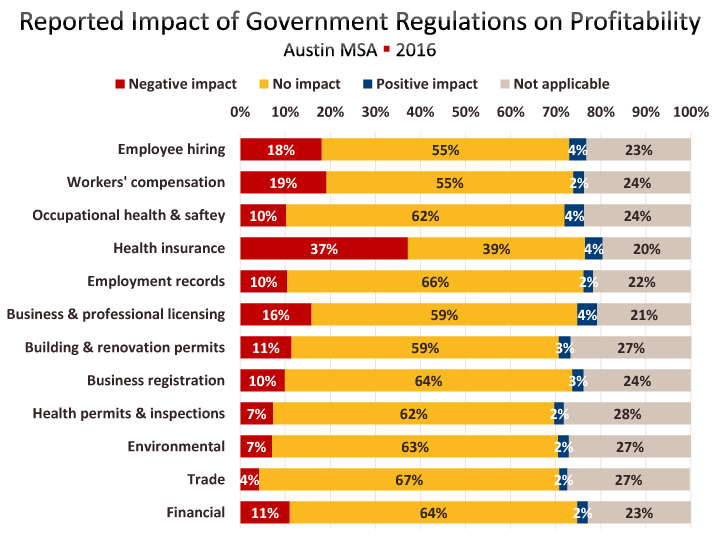
- In Austin, 30.2% of business owners report that they experience negative impact from government regulations and 69.8% report that they don’t. Nationally, slightly more report negative impact, 31.7%, and 68.2% report no negative impact.
- Austin ranks 30th for the percentage of businesses reporting that regulations have a negative impact on expanding business operations (14.2%). Three California metros, Sacramento (20.5%), Riverside, and San Diego, have the highest rates of businesses reporting negative impact. However, relatively few San Francisco business owners (12.9%, ranking 45th) say that the impact of regulation is negatively impacting expansion of business operations.
- Among various types of government regulations, health insurance yields the greatest number of businesses reporting “very negative” impact on profitability in Austin (17.3%), and another 19.9% report a “somewhat negative” impact. However, Austin’s proportion reporting a “very negative” is relatively low compared to most large metros (ranking 41st). In Oklahoma City, 24.5% of firms report that health insurance regulations have a very negative impact on profitability, while only 13.4% of Los Angeles respondents report the same.
- In Austin, 43.2% of firms are paying for some portion of employees’ health insurance putting the metro 13th among large metros. This coverage means that 80.2% of Austin workers have some portion of health insurance premiums paid by their employer and that rate puts Austin in the middle of major metros, ranking 25th.
- Businesses are asked a yes/no question about the impact of taxes on profitability. Austin businesses divide about half and half on the question (50.8% negative and 49.2% not negative). This rate of reported negative impact is high, ranking ninth among major metros. Nationally only 40.1% of respondents say taxes have a negative impact on profitability. When you think about what per capita state and local tax burden looks like across the country,[2] where metros array on this question is curious. Dallas-Fort Worth respondents are more negative (45.7%) than those from Los Angeles (45.2%) and Houston respondents are more negative (44.6%) than those from New York (44.4%).
- In Austin, 15.7% firms own intellectual property in the form of copyrights, trademarks, and patents. That share ranks fourth among major metros. Nationally, 9.1% own some form of intellectual property.
- Austin ranks relatively high, sixth, for the percentage of businesses (14.9%) that have 75% or more of their customers outside of their region. For over three quarters (78.7%) of Austin businesses, 75% or more of their customers inside the region.
- Austin has a relatively low percentage of exporting firms (11.1%, which ranks 43rd), yet ranks second for the percentage of firms (4.8%) that have operations outside the U.S.
- Austin ranks 10th for the percentage of firms (15.5%) that have ecommerce sales, and ranks 2nd for the percentage of employees (37.3%) working for firms with ecommerce sales.
- Austin is eighth for the percentage of businesses (2.7%) that outsource functions or services abroad.
- Austin has a larger share of its firms employing contractors, subcontractors, independent contractors, or outside consultants (46.5%) than any other large metro.
- Austin ranks high (third) for the percentage of business owners (40.1%) who previously owned one or more other businesses before acquiring their current business.
- In Austin, 12.2% of business owners were not born a citizen of the U.S. This rate is lower than the national rate of 15.9%. Among large metros this rate ranges from 41.5% in San Jose to 5.5% in Louisville. Houston has the largest share of these business owners (27.0%) among Texas metros.
- The survey asks about the field of the business owner’s highest academic degree. Although Austin has a fairly high profile as a hub for information technology, business owner’s whose highest degree is in information technology is 2.8%, which ranks 19th and is just above the national rate of 2.6%. The highest rates for IT degrees are Washington (7.1%) and San Jose (6.8%). Engineering is where Austin stands out. For this field Austin ranks fifth, with 10.7% of business owners holding this degree. The highest rates for engineering degrees are San Jose (20.7%) and Houston (12.7%). Business or finance is the most common field in Austin (28.8%) and nationally (29.9%).
FOOTNOTES:
[1]Next year, the Census Bureau will introduce the Annual Business Survey. The ABS is a new survey that will replace three existing surveys: the five-year Survey of Business Owners (SBO) for employer businesses, the Annual Survey of Entrepreneurs (ASE), and the Business Research and Development and Innovation Survey for Microbusinesses (BRDI-M), and includes a new innovation content module.
[2] State and local taxes per capita in 2016 were $4,020 in Texas, $6,077 in California, and $8,957 in New York. (U.S. Bureau of the Census, State & Local Government Finances.)
Related Categories: Central Texas Economy in Perspective