Commuting Patterns
Posted on 10/08/2019 by Chris Ramser
- In 2017, over 74% of the Austin MSA’s workforce lives within the 5-county region.
- Over 42% of the Austin region’s workforce commutes less than 10 miles, a greater share than in either Dallas or Houston.
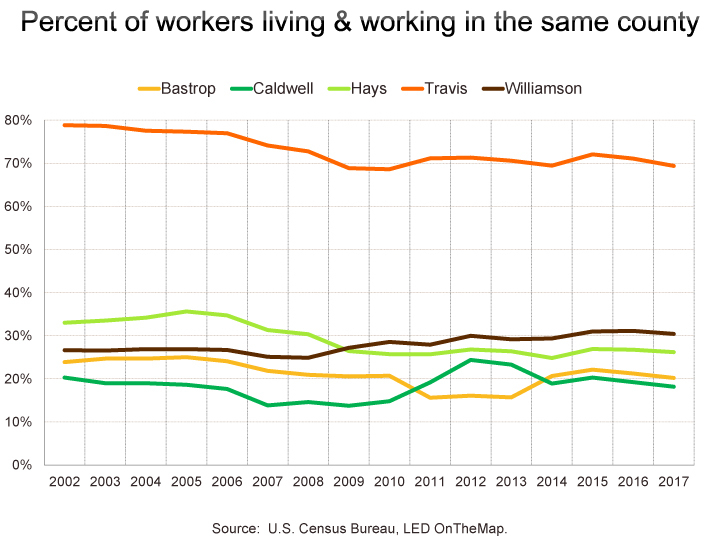
- The share of workers who live and work in the same county has declined since 2002 for each Austin MSA county, except Williamson.
New data recently released by the Census Bureau’s the Longitudinal Employer-Household Dynamics (LEHD) Origin-Destination Employment Statistics (LODES) program show that of the 1,004,341 jobs located in the Austin region, 74.4% (or 747,713) are held by residents who also live in the Austin metro. The other 256,628 jobs (25.6%) are filled by commuters coming in from outside of the five-county metro. An additional 219,871 jobs are held by residents of the Austin MSA region who travel to another county for their work.

With this release, the LEHD LODES data gives economic developers and planners valuable data for understanding the commuting patterns of workers. Accessed through the Census Bureau’s OnTheMap tool, the data provides a way to examine the relationship between a worker’s home and job location for geographic areas as small as the census block and by year going back to 2002.
Austin region job sites are spread throughout the five counties, but higher concentrations can be found in central Austin and in areas of North Austin along Mopac and US 183. Other pockets of higher concentration include areas such as Round Rock and San Marcos, as indicated on the map below.

Residence locations for the Austin metro workers appear distributed more broadly throughout the region with higher densities spread throughout Austin and into major regional communities of Cedar Park, Georgetown, Leander, Pflugerville, and Round Rock to the north, and Kyle and San Marcos to the south. This fairly simple observation may be confirmed by those residents who commute to work by automobile during rush hour, but more detailed and site-specific patterns can emerge by performing paired analysis of workplace and residence locations using the OnTheMap tool.

Commuting distance traveled by workers
In 2017, a higher portion of Austin MSA job holders, 42.2%, commute less than 10 miles from home compared to workers in the Dallas (36.2%) or Houston (36.7%) metros. In San Antonio, 46.3% of workers have commutes of less than 10 miles. Austin, however, has a greater share, 22.1%, of workers commuting over 50 miles than the other major Texas metros .[1]

Recently, the Austin Business Journal highlighted the rise of the “super commuter” in an article. They reported a study utilizing a different source of commuting data[2], showing that Travis County super commuters (those traveling three hours or more) were on the rise and accounted for about 1.6% of the workforce.
Over time, the percentage of Austin region job holders commuting less than 10 miles has declined. In 2002, the earliest available data, 47.4% of workers commuted less than 10 miles compared to 42.2% in 2017. The impact of the Great Recession in late 2008-2010 can be seen in this data as greater shares of workers travelled farther distances for work during the recession. As the graph below indicates, in 2009 more workers commuted over 50 miles (26.6%) than 10 to 24 miles (24.8%) and 2010 saw the lowest share of workers commuting less than 10 miles (40.6%) over the 15 years of available data.

County origins of Austin MSA workers
In addition to statistics on how far workers are commuting, summary data of their origin is also available by county, city, and smaller areas like zip codes and Census Blocks. Of the 1,004,341 jobs in the Austin MSA, 74.4% are held by residents living in the metro and 3.7% are held by the residents of the counties immediately to the north and 6.1% are from the counties immediately to the south. The map below shows the percent of Austin workers that commute from each of these central Texas counties. For example, 3.7% of the Austin region’s workforce is commuting from Bexar County and 1.5% are commuting from Bell County.

Commuting patterns of Austin MSA residents by county
For the 35,236 job holders living in Bastrop County in 2017, 20.2%, or 7,117, work in the county. Travis County is the commuting destination of 13,930 Bastrop residents (or 39.5% of workers living in the county). Harris, Williamson and Bexar counties are other top destinations. The map below shows the number of Bastrop residents commuting to each of the surrounding counties.

The top job destinations of the 18,017 workers living in Caldwell County are Travis County (5,376 or 29.8%), followed by Caldwell (3,272 or 18.2%), and Hays County (2,214 or 12.3%).

LEHD data shows 88,063 jobs held by Hays County residents in 2017 and 26.2% or 23,068 residents work within the county. Once again, Travis County is the top job destination for Hays residents with about 41.4% or 36,463 travelling to jobs in Travis County. Bexar County receives 5.1%, 4,462, of employed Hays County residents.

In Travis County, the majority of the working residents (69.4% or 394,179) stay in the county for their job. For those commuting to jobs outside of the county, some of the top destinations are Williamson County (42,264 or 7.4%), Bexar County (19,764 or 3.5%), and Hays County (9,399 or 1.7%).

Williamson County retains 30.4% or 78,574 of its working residents in the county for their job, while a larger percentage commute to Travis County (45.3% or 117,093). Other top destinations were Bexar and Bell Counties (3.2% and 2.0% respectively).

For all but Williamson County, the share of residents staying within their home county for work has dropped since 2002, according to the LEHD data. As the graph below indicates, Williamson has seen a slight but steady increase of workers that live and work in the county, increasing from 26.6% in 2002 to 30.4% in 2017.
Commuting patterns for selected work locations
The LED OnTheMap tool also provides the option to analyze site specific locations such as a radius selected by the user. Used in this manner, the tool can show where the current workers of a potential site are currently living. As examples of the type of output available, we ran a 1-mile radius of four different sites in the region: Downtown, The Domain, Round Rock, and San Marcos.
Within a 1-mile radius of 6th St. and Congress Ave. in Austin, OnTheMap shows a total of 128,547 workers in 2017. The top five home origin zip codes of these workers are 78704 (5,979 or 4.7%); 78745 (5,760 or 4.5%); 78748 (4,228 or 3.3%); 78741 (4,007 or 3.1%); and 78660 (3,559 or 2.8%). A choropleth map showing the home origin of these Downtown workers is easily generated with the tool.

Within a 1-mile radius of Esperanza Crossing and Domain Dr. in Austin, OntheMap shows a total of 21,007 workers in 2017. The top five home origin zip codes of these workers are 78613 (1,016 or 4.8%); 78758 (944 or 4.5%); 78759 (925 or 4.4%); 78681 (805 or 3.8%); and 78660 (778 or 3.7%). The map below illustrates the home origins of workers employed in The Domain area.

Within a 1-mile radius of I-35 and Gattis School Rd. in Round Rock, OnTheMap shows a total of 21,595 workers in 2017. The top five home origin zip codes of these workers are 78681 (1,733 or 8.0%); 78664 (1,658 or 7.7%); 78660 (1,322 or 6.1%); 78613 (1,222 or 5.7%); and 78665 (1,166 or 5.4%). A map of the home origin of workers at jobs sites in this area of Round Rock is shown below.

Lastly, within a 1-mile radius of Hopkins St. and Guadalupe St. in San Marcos, OntheMap shows a total of 14,552 workers in 2017. The top five home origin zip codes of these workers are 78666 (4,969 or 34.1%); 78640 (1,102 or 7.6%); 78130 (646 or 4.4%); 78610 (379 or 2.6%); and 78132 (307 or 2.1%). The map below illustrates the home origin of workers employed in central San Marcos.

Through the LED OnTheMap tool, the Census Bureau provides a free and easy to use web-based interface for understanding commuting patterns and trends. In addition, LED OnTheMap provides the ability to analyze an area and the commuting patterns of its workforce by worker age, earnings, educational attainment, race or ethnicity, and industry of employment. For a tutorial on using OntheMap, visit this link.
FOOTNOTES:
- Because these numbers may seem high for estimates of employees commuting over such distances, it is important to consider the source of data. LEHD data is derived from information companies submit for the unemployment insurance program. The LEHD On the Map tool maps the relationship between the job holder’s address and the address of the establishment where they work. Workers may be telecommuting from home or the road, or may be commuting to a worksite or field location different from the address of record for the reporting establishment. Either way, apart from some amount of erroneous information that may be expected from administrative records, the circumstance can be said to represent economic ties between the geographically separated metropolitan economies. ↩
- The Census Bureau’s American Community Survey also provides an average commute time, as well as a categorical breakdown of the amount of time spent by workers commuting to a job. Other demographic and other characteristics of workers is also available. ↩
Related Categories: Central Texas Economy in Perspective