Local Employment Dynamics: Quarterly Workforce Indicators for Selected Advanced Industries
Posted on 08/16/2016 by Beverly Kerr
- The largest industry within Austin’s tech sector, Computer Systems Design and Related Services, grew by 189% over the last decade.
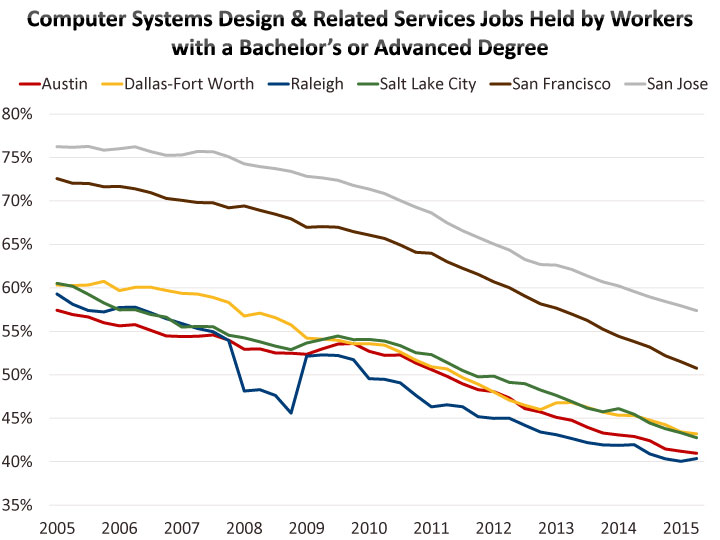
- Ten years ago, 57% of workers in that industry in Austin held a bachelor’s or advanced degree. The rate declined to 41% by 2015, a pattern similar to other tech centers.
- Average earnings for Austin workers in that industry grew 31% over the last decade, however, new hires have seen earnings rise only 27%.
- The 9.2% turnover rate in Austin’s Computer Systems Design and Related Services in the first quarter of 2015exceeds the rate of two of five comparison markets, however the replacement hiring rate of 5.9% is lower than all but one.
Austin has an extraordinary percentage of jobs in advanced or high tech industries compared to most major U.S. metros. Earlier this month, the Brookings Institution released a new report, America’s Advanced Industries: New Trends, detailing industry shares and growth rates for advanced industries in the 100 largest U.S. metros. Austin ranks 9th for advanced industries share of all jobs (13.1%) and also ranks high for growth of advanced industries jobs (10th for 2010-2013 and 12th for 2013-2015).
Since we recently treated high tech industry trends with another data set, this article isn’t going to detail further findings of the Brookings Report. However, Austin’s top advanced industries, as well as metros with similar major advanced industries in common, as identified by Brookings, present an interesting set to examine in an analytic tool from the Census Bureau called Quarterly Workforce Indicators (QWI). [1]
With Austin and select other regions offering business concentrated talent pools in several specific advanced industries, what do varying industry growth trajectories, firm characteristics, and worker characteristics have on, for example, job churning or turnover, and other labor market dynamics?

QWI is an innovative product using job-level microdata linking workers to their employers. QWI provides local market statistics on employment, earnings, and jobs flows (hires, separations, turnover, etc.) at detailed levels of industry and other firm characteristics like age and size, as well as worker characteristics like age, educational attainment, gender, race, and ethnicity. QWI can answer many questions about the supply of talent most specifically relevant to a particular industry and location that cannot be answered by traditional labor market indicators.
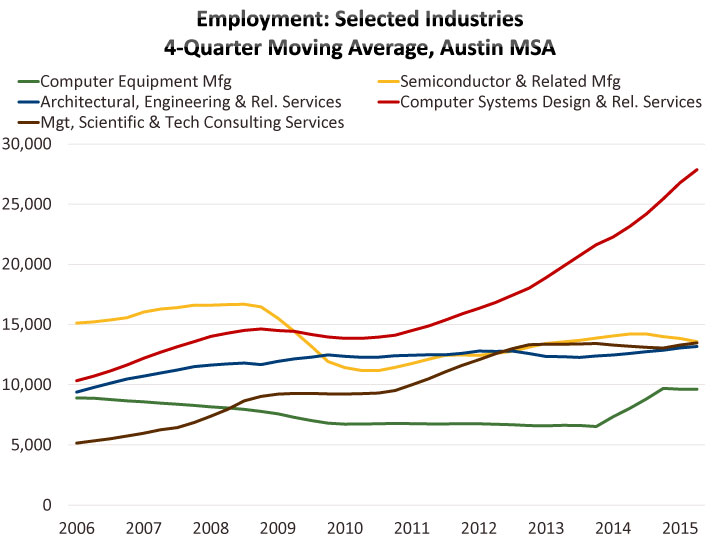
Austin’s five largest advanced industries at the 4-digit NAICS level[2] include two manufacturing industries and three services industries: Computer Systems Design and Related Services (NAICS 5415); Management, Scientific and Technical Consulting Services (5416); Architectural, Engineering and Related Services (5413); Semiconductor and Other Electronic Component Manufacturing (3344); and Computer and Peripheral Equipment Manufacturing (3341).

Computer Systems Design and Related Services[3] accounts for by far the largest number of advanced industry jobs in Austin—approaching 30,000. The industry is also the most significant advanced industry in Dallas-Fort Worth, Raleigh, Salt Lake City, San Francisco, and San Jose—markets that Austin consistently competes with for job-creating corporate investments.
The fastest growing of Austin’s five largest advanced industries is also Computer Systems Design, growing 189% over the last decade. In contrast, jobs in Semiconductor & Related Manufacturing contracted 10% during the decade and Computer Equipment Manufacturing grew by 9%. Management, Scientific & Technical Consulting Services grew a very robust 174% and Architectural, Engineering and Related Services grew 47%. Private industry job growth overall for the decade was 39%.

Austin’s Computer Systems Design industry out performs the comparison metros for the rate of job growth over the decade. San Jose, which has the largest share of its jobs in the industry (7.4%) saw the slowest growth of the six metros between 2005 and 2015 (53%).
Simple employment trends, however, are not the distinctive value-add provided by QWI. QWI’s measures of employment change at the individual level and at the firm level are what can be used to illuminate the dynamics of the labor market. The graph below overlays hires and separations as a percent of employment with the employment trend for all private jobs and jobs in computer systems design.

What industries or localities or age groups are subject to the most or least churning or turnover is a question frequently asked by corporate human resources professionals and other analysts in a multitude of roles.
Hires, separations and employment are the variables used to calculate churn or turnover. The quarterly turnover rate in QWI is calculated by summing the number of hires in the reference quarter and separations in the next quarter, and dividing by average full-quarter employment times two.
The graph at the beginning of this article compares Austin, Texas, and the nation beginning in 1996. Dips in the rate correspond to the early 2000s and late 2000s recessions. Numerous articles (google “labor market churn”) discuss possible reasons, such as slow wage growth, for the lack of rebound in churn or turnover to pre-recession levels. The following graph shows turnover rates for Austin’s largest advanced industries.

Turnover rates in the Computer Systems Design industry vary among the comparison metros, with Austin largely tracking in the middle of the range.

If you are hiring for that industry, but are primarily interested in degreed candidates, you might use QWI to look at turnover for workers in the industry with a bachelor’s or advanced degree. Austin’s turnover rate for these workers in recent years exceeds the rates of the comparison metros.

Given the wide range of rates of job growth in this industry between the metros that was illustrated above it may be important to consider that hires in the turnover calculation reflect job creation as well as replacement hires. Comparing the metros on the replacement hiring rate provided by QWI reorders how they rank from high to low.

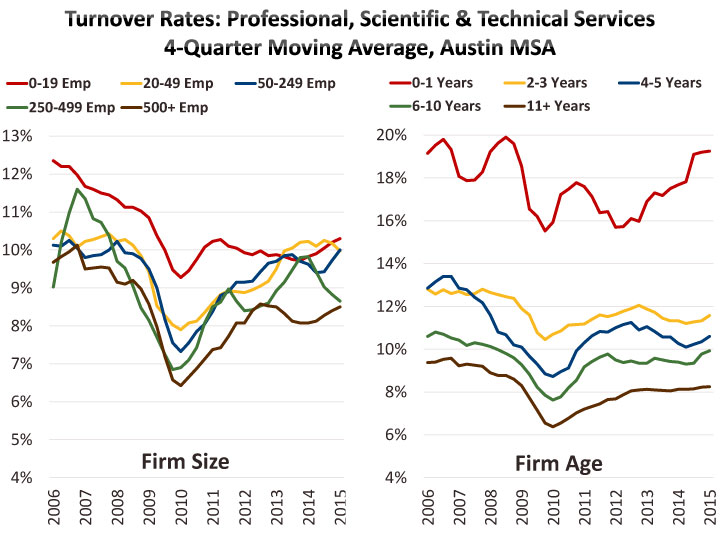
A company wanting to compare turnover in their industry and their local labor market to firms of similar size or age can also do that with QWI. When utilizing firm age and size, industry groups are limited to the “sector” level (2-digit NAICS). Computer Design Services is part of the Professional, Scientific and Technical Services sector.


A multitude of types of inquiry could be pursued with QWI data by firm age and size. What kinds of workers are being hired by startups? In what industries are startups creating the most jobs? What metros are experiencing the most startup-related job creation? And similarly for inquiry into small business, etc.
If you want to look at differences between the incumbent workforce and new hires and separations by detailed industry, QWI offers that data as well—sex, age, race and ethnicity, and educational attainment.

The graph above illustrates the trend in average monthly earnings for all workers, new hires, and separated workers in Austin’s Computer Systems Design industry. There appears to be a spike in separations of higher paid workers during the last recession. Over the course of the decade, earnings of new hires has not quite kept pace with the earnings of all workers (up 27% vs. 31%, comparing the year ending 2015 Q2 to 2005).


San Jose’s Computer Systems Design workforce is older and more educated than the other metros.


What seems curious however is the decline, common to all of the metros, in the share of jobs in Computer Systems Design held by workers with a bachelor’s or advanced degree. QWI indicates 57% of the industry workforce in Austin held at least a bachelor’s degree 10 years ago and the share has fallen to 41% in 2015.

Not all of Austin’s top advanced industries have seen this kind of change. Computer Equipment Manufacturing’s rate dropped 3 points to 45%, Semiconductor and Related Manufacturing dropped 4 points to 34%, Architectural, Engineering and Related Services dropped 8 points to 38%, and Management, Scientific and Technical Consulting Services dropped 13 points to 33%. The rate for all private industry workers moved from 25% to 23%.

[1] QWI data can be analyzed directly within the QWI Explorer application in the Local Employment Dynamics (LED) Partnership section of the Census Bureau’s website. QWI Explorer provides an intuitive interface using pivot tables and charts/maps to analyze labor-force indicators such as employment, job creation and destruction, hires, and wages across a wide range of geographies and firm and worker characteristics. Recently QWI Explorer added thematic mapping. If you prefer to download data to use offline in other applications, the LED Extraction Tool is an alternative means to streamlined access to the entire set of raw Quarterly Workforce Indicators (QWI) data through an intuitive query-building interface.
[2] Brookings defined advanced industries as a group of 50 R&D- and STEM-worker intensive industries. Brookings worked with industries at the 4-digit NAICS classification level (industries can be grouped or disaggregated at levels from 2-digit to 6-digit detail in the North American Industry Classification System).
[3] This industry comprises establishments primarily engaged in providing expertise in the field of information technologies through one or more of the following activities: (1) writing, modifying, testing, and supporting software to meet the needs of a particular customer; (2) planning and designing computer systems that integrate computer hardware, software, and communication technologies; (3) on-site management and operation of clients' computer systems and/or data processing facilities; and (4) other professional and technical computer-related advice and services. Illustrative Examples: Computer facilities management services, Custom computer programming services, Computer hardware or software consulting services, Software installation services, and Computer systems integration design services.
Related Categories: Central Texas Economy in Perspective