Residential Permit Activity
Posted on 08/07/2018 by Beverly Kerr
- The Austin metro ranks sixth for total housing units permitted in the first six months of 2018, surpassed only by Dallas-Ft. Worth, Houston, New York, Atlanta and Los Angeles.
- Austin has the highest level of per capita housing permit activity among the top 50 U.S. metros in 2018.
- Multifamily accounts for 47% of units permitted in the metro in 2018, up from 39% in 2016-2017.
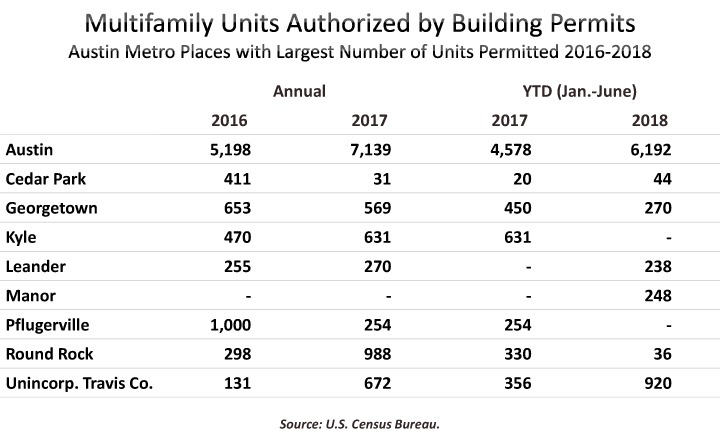
- Half of all units permitted in 2018 were in the City of Austin (2,259 single-family units and 6,192 multifamily units).
Austin ranks as the 31st largest metro based on population, however, more housing units were permitted here in 2017 than in all but eight metros (Dallas-Ft. Worth, New York, Houston, Atlanta, Los Angeles, Phoenix, Seattle, and Washington—each among the top 15 largest U.S. metros). In 2018-to-date, Austin ranks sixth for total permits issued, surpassed only by Dallas-Ft. Worth, Houston, New York, Atlanta and Los Angeles.

Single-family activity was higher in Austin than almost anywhere else in both 2017 and in the first 6 months of 2018. Austin issued the fifth largest number of single-family housing permits among major metros in 2017 (behind only the much larger Houston, Dallas-Ft. Worth, Atlanta, and Phoenix markets). Austin ranks fifth for total single-family permits issued in 2018 (behind the same four other markets). Austin ranked 10th for multifamily units permitted in 2017, but in 2018 Austin has issued the sixth largest number of permits (behind New York, Dallas-Ft. Worth, Los Angeles, Seattle, and Miami).
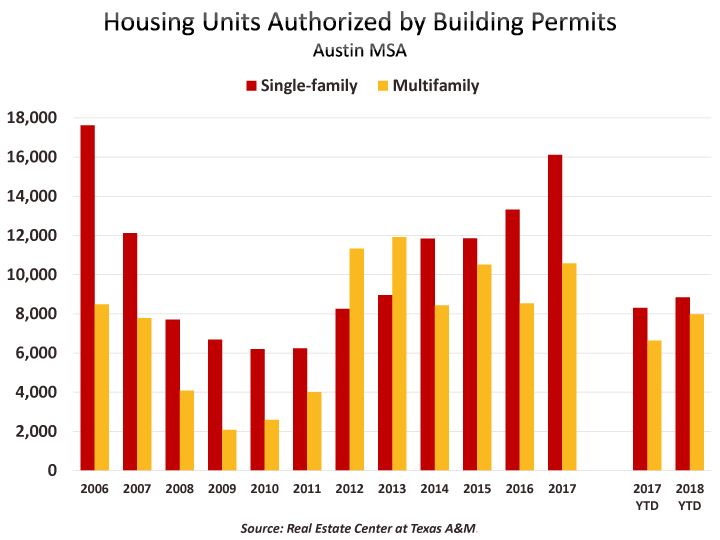
In 2017, housing units permitted in the Austin metropolitan area totaled 26,700, surpassing the prerecession peak attained in 2006. Based on the first six months of this year, 2018 is likely to attain a new peak in total permits. Total housing units permitted to date in 2018 (16,809) is 12.5% ahead of the first half of 2017. But 2018 growth is slower than the 22.1% increase of 2017 over 2016.

The value of housing permitted to date in 2018 is $2.7 billion, up 19.0% over the first half of 2017. The total value of permits in 2017 was 14.6% above the value permitted in 2016.
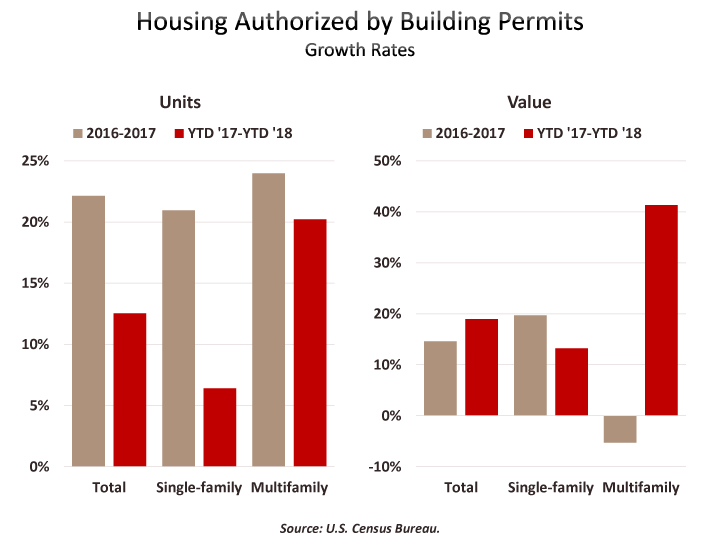
Single-family units permitted in the first half of 2018 total 8,836 (52.6%) and multifamily units total 7,973 (47.4%). In 2017, 60.4% of units were single family and 39.6% were multifamily. While total housing production as represented by permits now exceeds the prerecession peak, single-family units in 2017 (16,111) were still below the 17,615 permitted in 2006. If the second half of 2018 produces as many single family permits as the first half, 2018 will attain a new peak in single-family activity.

The average value of a single-family unit in 2018 is $235,511, up 5.9% over the average value in the first half of last year. Multifamily units permitted average $84,759 thus far in 2018, up 17.5% over the first half of 2017.

Nationally, 2018 permit activity is up 4.4% year-to-date, following annual growth of 5.9% in 2017. Single-family units are up 6.0% while multifamily is up 1.4% over the first half of 2017. The total value of permits in 2018 is up 9.0% over 2017 year-to-date. The average value of multifamily units ($130,926) is up 12.5% compared to 2.2% for single-family ($245,642). Multifamily accounts for 34.0% of total permits in the first half of 2018, down from 35.1% in 2017. The last time multifamily permits accounted for a smaller share of all permits nationally was 2011.

Texas, with 8.7% of the U.S. population, accounts for 14.7% of housing units permitted in 2018. Austin, which currently represents 0.6% of the U.S. population, accounts for 2.5% of U.S. permits in 2018. Austin is also taking an outsize share of Texas permits as well. While Austin is presently 7.5% of the state population, it has issued 17.0% of units permitted in 2018.
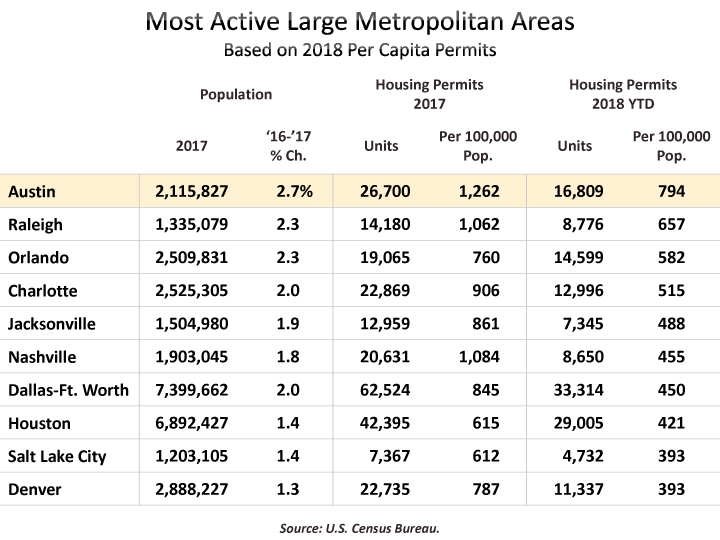
Austin’s 26,700 total permits in 2017 translates to 1,262 per 100,000 population, which was the highest rate of per capita activity among the 50 largest U.S. metros. Austin’s 16,809 permits issued in the first 6 months of this year amounts to 794 permits per 100,000 population and that is also the highest rate among large metros.


This relatively robust level of activity would seem to signal that the region might be making a dent in the supply conditions that place upward pressure on regional home prices and rents. However, tightness, particularly of the sales market, remains a widely cited issue in Austin. The supply of homes for sale in the metro has only inched over three months a handful of times since 2012 (a balanced market offers over six-months supply according to the Real Estate Center at Texas A&M).

Given Austin’s rapid population growth, permits issued relative to net population growth may be something else to consider. A couple of representations below show of how Austin compares to the top 10 most active metros in 2018, as well as to Texas other metros, on permit activity per 1,000 new residents.
Note that while this article is focused on permit activity, and permits relative to population and population growth, an in depth analysis of supply and demand conditions in the Austin metropolitan area’s housing market was recently published by the U.S. Department of Housing and Urban Development (HUD). HUD produces Comprehensive Housing Market Analyses for major metros every couple of years and the newest report on Austin presents data as of April 2018 and includes demand forecasts through April 2021. According to the report, if the current pace of production of rental units (13,900 under construction) is maintained, Austin appears to be on course to meet projected demand (29,950 units through April 2021), however total demand for sales units is projected to total 51,700. The 4,550 units under construction as of April 1 will only meet part of the first year’s demand.
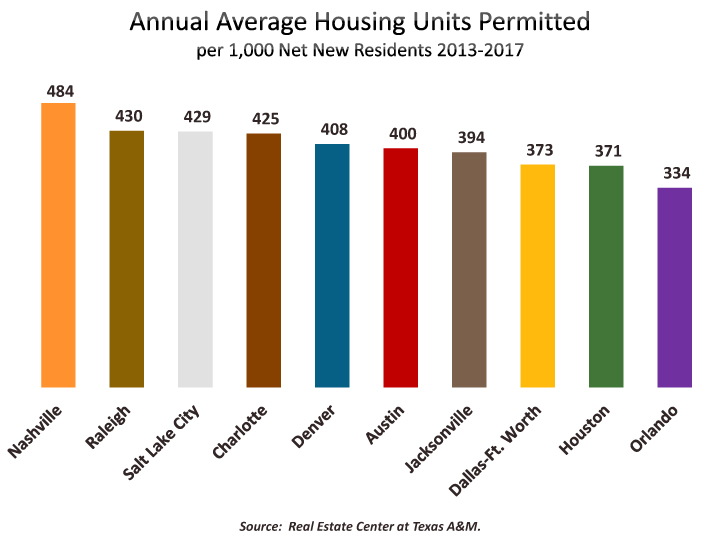
For the top 10 major metros based on 2018 per capita permit activity, the following bar graph represents annual average housing units permitted per 1,000 net new residents over the last five years. Among 2018’s high performing metros, Austin’s permit production rate per net new resident over 2013-2017 is, more or less, middle of the pack.
The line graph below represents the trend in this rate since 2001 for Texas major metros. While Austin has averaged 400 housing units permitted per 1,000 net new residents over the last five years, the other major Texas metros range lower—from 206 (San Antonio) to 373 (Dallas-Ft. Worth).

The following graph and tables show the distribution of housing units permitted in the Austin MSA by county, single-family permit activity by city, and the largest places in the metro for new multifamily activity.


Places shown in the table above represent the communities with the largest numbers of single-family permits for 2016-2018, plus additional places with more than 9,000 residents in 2017.
Additional analysis/data:
- U.S. Census Bureau, Building Permits Survey.
- Real Estate Center at Texas A&M, Building Permits.
- U.S. Department of Housing & Urban Development, Comprehensive Housing Market Analysis: Austin-Round Rock, Texas, 2018.
The Chamber’s Economic Indicators page provides up-to-date historical spreadsheet versions of Austin, Texas and U.S. housing permtis data as published by the U.S. Census Bureau and the Real Estate Center at Texas A&M.
Related Categories: Central Texas Economy in Perspective