Total Sales & Retail Sales Trend
Posted on 06/16/2015 by Chris Ramser
- The Austin region’s all-industries gross sales were up 8.5% in 2014 over the prior year compared to statewide growth of 6.4%.
- Of the $93.0 billion in sales reported for Austin in 2014, $33.4 billion comes from outlets classified as retailers. Retail sales grew by 7.5% from 2013 to 2014.
- Retail sales in Austin are 44% above 2008 levels, the year prior to the Great Recession—greater growth than seen by Texas’ four other major metros.
- Sales growth for Q4 2014 over the same quarter of 2013 was best among Austin’s motor vehicle dealers (up 26.4%), followed by building material stores (14.6%), health and personal care stores (12.6%), and home furnishing stores (10.8%).
Gross sales reported by Austin metro sales and use tax permit holders were up by 8.5% in 2014 over the prior year, compared to overall statewide growth of 6.4%[1]. Texas other major metros also experienced positive sales growth. Fort Worth and San Antonio were up 10.7% and 10.8%, respectively. Dallas and Houston sales grew at slower rates, 3.3% and 4.0%, respectively. Data through the fourth quarter of 2014 was released late last month by the Texas Comptroller.

Gross sales in 2014, at $93 billion, are more than double the amount reported in 2002 ($45 billion) for the Austin metro. Prior to the recession, sales climbed to a peak of $74 billion in 2008 before dropping the following year by 11% to just $66 billion. Over the subsequent five years, steady growth has been the norm with annual growth rates ranging from 5.7% to 9.0%.

Austin’s gross sales in 2014 are 25.5% above 2008, the pre-recession peak. Among Texas’ major metros Houston does best, with 2014 gross sales being 31.4% above 2008. Over a quarter of the difference between 2008 and 2014 for Houston is due to the natural resources industry.

Austin leads the major Texas metros for retail sales growth since 2008. Between 2008 and 2014, Austin retail sales increased 44.4%. The table above indicates the comparable rates in the other major metros. Note that the Dallas retail sales series presents an anomalously high total for 2008. Dallas retail sales in 2014 are up between 11% and 12% compared to 2007 or 2009.

Within the Austin metro, retail trade constitutes the largest component of gross sales, generating 36% of total sales, or $33.4 billion in 2014 and growing at a rate of 7.5% over the last year. The second largest contributor, manufacturing, generated $15.2 billion in sales or 16.4% of total sales. The third and fourth most significant industry segments in the Austin metro were relatively similar in amount, construction at $9.8 billion and wholesale trade at $9.1 billion, about 10.5% and 9.8% of all sales. Another notable sector, accommodation and food services, reported $4.9 billion in sales in 2014 and accounted for 5.2% of all sales. The graph above shows the 2014 sales as well as the percent change experienced in each of the industry sectors between 2013 and 2014.

Between 2013 and 2014, Fort Worth lead with 11.9% growth in retail sales, followed by Dallas with 7.9%, Austin with 7.5%, Houston with 6.6%, and San Antonio with 5.7%. As noted above, Austin has seen the greatest gain in retail sales since 2008 (44.4%).

In Austin in 2014, $7.4 billion in retail sales were reported in the first quarter, followed by $8.3 billion in the second and third quarters, and $9.4 billion in the final quarter.

The Comptroller’s quarterly sales and use tax analysis reports breakout the retail trade sector by store type. Of the $9.4 billion in gross sales in retail trade during the Q4 2014, $2.01 billion was reported by motor vehicle dealers, followed by food and beverage stores reporting $1.63 billion in sales. General merchandise, which includes department stores and warehouse clubs, was third with $1.49 billion in sales. The top three categories statewide were motor vehicle dealers, followed by general merchandise and food and beverage. The fourth largest retail type statewide was gas stations, which ranked only eighth in the Austin metro.

Fourth quarter year-over-year growth rates for sales by retail outlet type are shown for the Austin metro and the State as a whole in the graph above.
Motor vehicle dealers in Austin reported the best rate of sales growth (26.7%) in 2014 Q4 compared to the same period in 2013. Other sectors experiencing high levels of sales growth were building material outlets (paint, hardware, and lawn and garden stores) with growth of 14.6%, health and personal stores (pharmacies, optical stores, health supplement stores, and cosmetic stores) growing at 12.6%, and sales at home furnishing stores up 10.8%.
Non-store retailers, which include outlets such as vending machine distribution, mail-order catalogs, infomercials, and door-to-door solicitation, to name a few examples, declined by 26.9%. The only other store type to experience a drop in sales in Q4 2014 over Q4 2013 was electronics and appliance stores, which saw sales fall by 1.7%.
Gross Sales by County, All Industries
Percent Change from Q4 2013 to Q4 2014
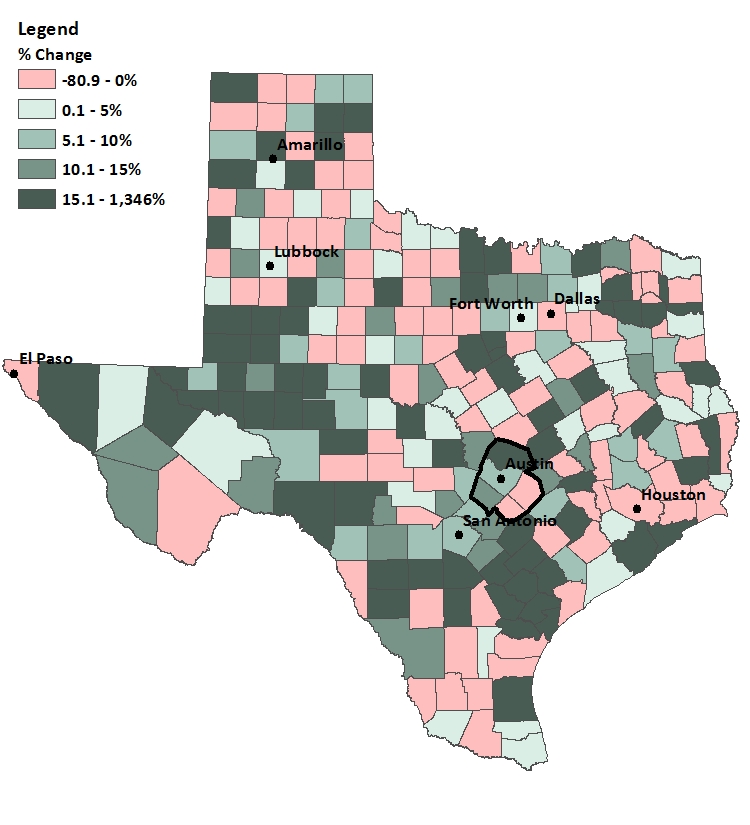
Total sales across all industries declined in 88 of Texas’ 254 counties in the fourth quarter of 2014 compared to the same period in 2013. Sales were up in three Austin MSA counties and down in two. Williamson County gained 15.4%, Hays County was up 10.7%, and Travis County sales increased 5.7%. Bastrop County and Caldwell County sales were down 1.7% and 4.0%, respectively.
Dallas County and Houston's Harris County saw negative growth of -2.1% and -7.3%, respectively.
Gross Sales by County, Retail Trade
Percent Change from Q4 2013 to Q4 2014

Retail sales were higher in the final quarter of 2014 compared to the final quarter of 2013 in each of the Austin metro’s counties. Growth was 10.8% in Bastrop County, followed by 10.6% in Hays County, 6.4% in Travis County, 6.3% in Williamson County, and 1.0% in Caldwell County. Houston's Harris County showed a negative growth rate of 5.8%.
Additional Data
The Comptroller’s quarterly total and retail sales data is included in the Chamber’s monthly Economic Indicators report.
In addition to gross sales discussed above, the Comptroller's data includes the amount of sales subject to state sales tax, which would be useful in a fiscal context. The number of outlets is also reported.
It should also be noted that there is an alternative series of quarterly retail sales data for Texas metros produced by the Federal Reserve Bank of Dallas. Their data, derived from the Comptroller’s data, is both seasonally adjusted and adjusted for inflation. They have yet to update their series through the fourth quarter, so the data was incorporated into the discussion above. The first three quarters of 2014 show inflation-adjusted retail sales up 5.7% over the first three quarters of 2013 in Austin. Houston’s real growth was highest, at 11.0%. Growth in Dallas, Fort Worth and San Antonio was 5.5%, 3.0% and 4.2% respectively.
Footnote:
[1] Texas totals in this article include sales by both in-state and out-of-state retailers that do business in Texas. Separate out-of-state and in-state sales totals by industry are also available on the Comptroller's website. Out-of-State outlets doing business in Texas (which represent only 19.7% of the state's total sales) were up 13.0% last year, while sales at outlets located within Texas were up only 4.9%.
Related Categories: Central Texas Economy in Perspective