High Tech Industry
Posted on 06/06/2017 by Beverly Kerr
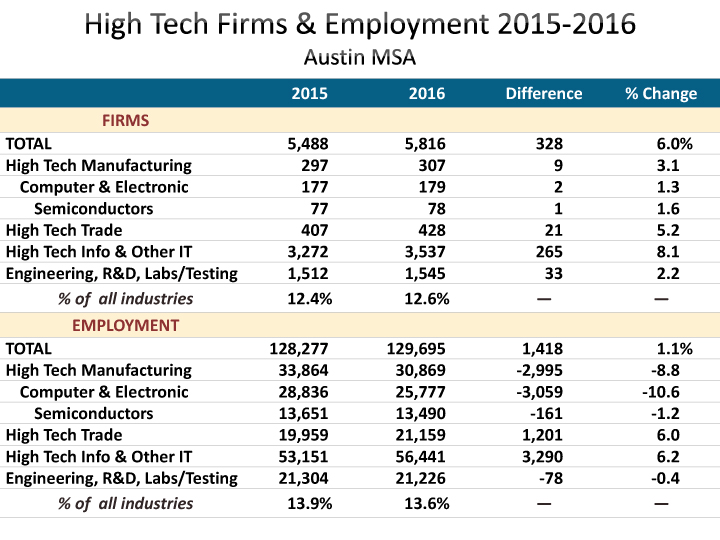
- There are more than 5,800 high tech employers in the Austin metro.
- Jobs in Austin’s tech industries total nearly 129,700, or 13.6% of all jobs, compared to 6.7% nationally.
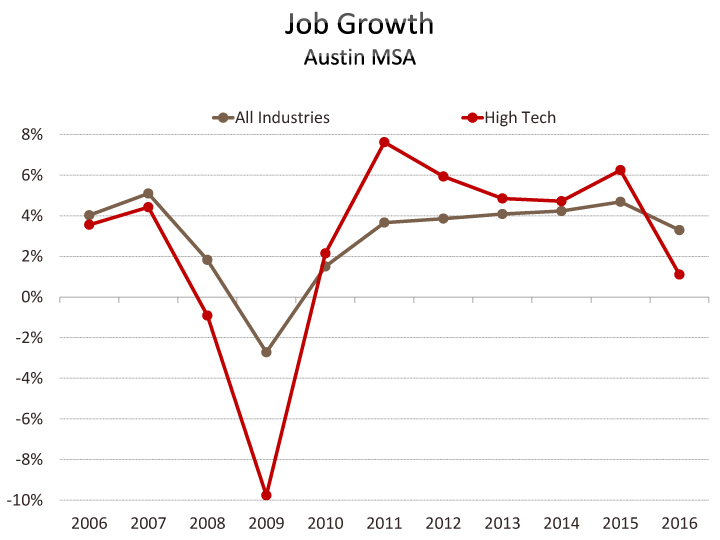
- In 2016, jobs in Austin’s high tech industries grew by 1.1%. This is the first time since the end of the last recession that tech job growth falls short of overall job growth.
- Austin high tech manufacturers contracted by 2,995 jobs (-8.8%) from 2015 while nonmanufacturing tech companies added 4,412 jobs (+4.7%).
Annual average employment in high tech industries in the Austin MSA in 2016 was 129,695, up 1.1% from 2015. That’s a smaller gain than the 3.3% increase for employment across all industries. High tech jobs represent 13.6% of all Austin area jobs in 2016 but only 4.7% of the year’s net new jobs. Nationally, high tech accounts for 6.7% of all jobs.

Over the last five years, employment in high tech industries has grown by 24.9%, compared to 21.8% for all industries in Austin. However, over the last ten years, the gain for high tech (28.2%) falls short of the gain for all industries (33.5%). The recession’s impact on Austin jobs was a loss of nearly 20,000 jobs and half of those jobs were in high tech. Thus, while high tech jobs have grown faster than all jobs in six of the last 7 years, as of 2016, tech’s current 13.6% share of all jobs is slightly below levels maintained before the recession.
New industry data through the final quarter of 2016 was recently released by the Texas Workforce Commission (TWC). The Quarterly Census of Employment and Wages (QCEW) produces much finer industry detail than the monthly Current Employment Statistics program and allows users to examine trends in distinct and narrow sectors like computer systems design or scientific R&D at the metro or even the county level. Since Austin is one of the most technology intensive metro economies in the U.S., we regularly examine new releases of QCEW to quantify the character and trends of Austin’s tech sector.[i]

There are 5,816 high tech employer firms in Austin (12.6% of total). Although there was a small decline in total firms in Austin in 2008, the recession did not cause the number of high tech firms to fall. The number of tech firms grew by 328 or 6.0% in 2016. Total firms in Austin number 46,175 in 2016, up 1,910 or 4.3% over 2015. High tech firms are a larger percentage of total firms now than before the recession (the share was 11.2% in 2007). Over the last five years, the number of firms has grown 35.6% in high tech industries compared to 25.7% overall. Among Austin's high tech firms, 5.3% (307) are manufacturing and 94.7% (5,510) are nonmanufacturing.
High tech payrolls in 2016 totaled $13.8 billion, or 25.2% of the Austin metro’s total payroll of $54.7 billion. Total payroll growth in 2016 was 5.1%, while the gain for high tech industries was 3.7%. High tech payrolls have also seen a smaller increase over the last 5 years—33.8% compared to 38.3%. Over the last decade total payrolls are up 66.5% compared to 47.5% for tech payrolls.
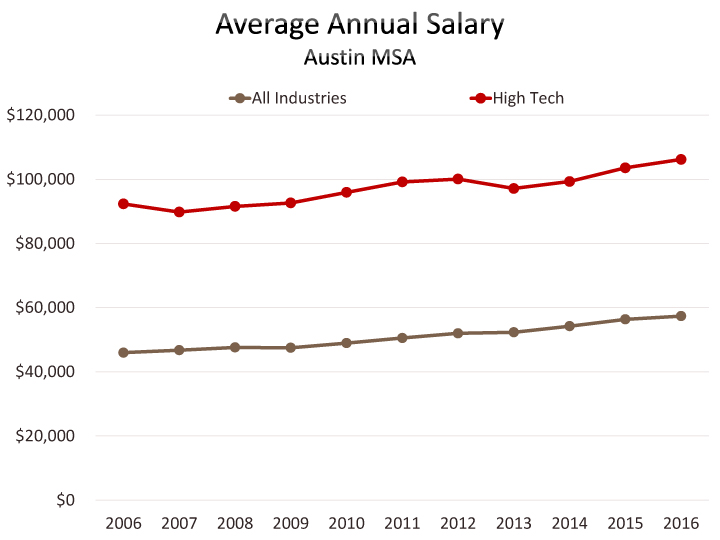

For all industries, the average annual salary in Austin is $57,341, up 1.8% from 2015, while the average salary for high tech jobs is $106,174, up 2.5%. Since 2011, the all-industries average annual salary is up 13.5% and the average tech salary is up 7.1%. High tech salary growth in Austin primarily faltered relative to all industries in 2007 and 2012. A decade ago, the average high tech salary was 201% of the average salary. The average high tech salary registered a low of 182% of the all-industries salary in 2014 and is at 185% in 2016.

Austin’s high tech employment is 23.8% manufacturing industries (30,869 jobs) and 76.2% nonmanufacturing industries (98,826 jobs). Manufacturing’s share has declined significantly over the long term. After climbing nearly back to prerecession-level jobs in 2014 (34,099), growth was negative in 2015 and 2016 (-0.7% and -8.8% respectively) in high tech manufacturing. High tech’s share of all manufacturing jobs in Austin is 55.8% in 2016, down from 58.5% in 2015.


Computer and electronic product makers (179 firms) dominate Austin’s high tech manufacturing jobs (25,777 or 83.5%). Of those jobs, 13,490 are in semiconductor and electronic components and 9,026 jobs are in computers and peripheral equipment. Pharmaceuticals and medicines manufacturing employs 1,896 and medical equipment and supplies manufacturing employs 1,147.

Austin has a location quotient (LQ) of 1.9 for the collection of industries making up high tech manufacturing, meaning that Austin employs workers in the sector at nearly two times the national rate.[ii] Austin’s computer and electronics manufacturing industry employs workers at nearly four times the national rate.

Salaries are higher in high tech manufacturing, $124,707, compared to the average of $100,385 in nonmanufacturing high tech industries. In Austin’s tech sector, manufacturing salaries have gained 5.5% over the last five years, while the nonmanufacturing average has risen 9.3%. Over the same period, the average salary for all industries rose 13.5%. Over the last year, salaries in high tech manufacturing salaries in tech industries fell 0.9%, high tech nonmanufacturing gained 5.1%, while the average salary for all industries increased 1.8%.
Nonmanufacturing high tech industries include subsectors of trade, information, professional and business services, and education and healthcare.

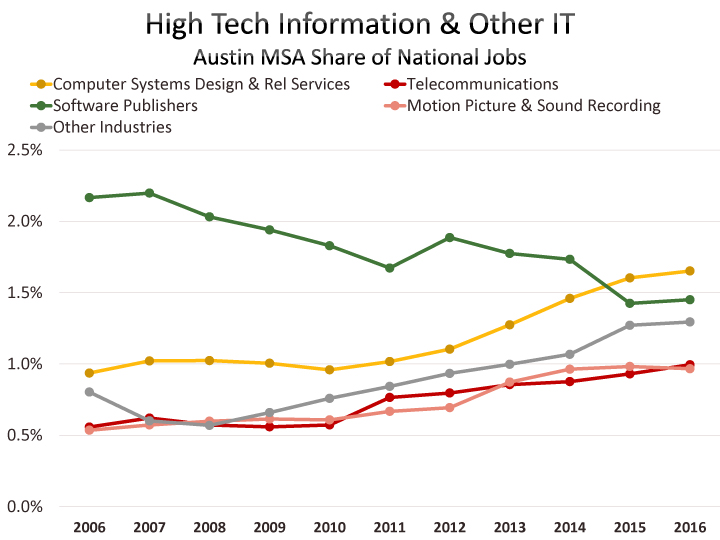
The high tech portions of the information industry include software publishers (172 Austin firms); motion picture and sound recording (218); telecommunications (119); data processing, hosting and related services (147); and internet publishing, broadcast and web portals (160). Other IT-related industries include computer systems design and related services (2,693 firms)in the professional and business services sector and computer training (28) in the education sector. Combined, high tech information and other IT accounts for 56,441 jobs and 3,537 firms in Austin in 2016. Jobs in this group of industries are up 6.2% (3,290) in just one year, dominating the net jobs added (4,412) by nonmanufacturing tech industries in 2016. Computer systems design and related services[iii] employs 32,486 and grew by 6.2%, or 1,887 jobs, in 2016.

Austin has a LQ of 2.0 for the group of industries we’re calling high tech information and other IT, meaning that Austin employs workers in the sector at two times the national rate.
The average annual salary in high tech information and other IT was $105,622 in 2016, with software publishing and computer systems design and related services being the best compensated industries ($116,218 and $118,428 respectively). Salary gains (5.6%) were above average (all industries grew 1.8%) in 2016. The industry group gained 20.1% over the last 5 years, compared to 13.5% for all industries.
After computer systems design and related services, the next largest nonmanufacturing tech industry is computer and software merchant wholesalers (139 firms) which employed 18,760 in Austin in 2016, up 761 jobs or 4.2% from 2015. This trade industry, together with business-to-business electronic markets and electronic shopping represents 428 firms and 21,159 jobs in Austin’s high tech trade industries. Employment in high tech trade is 11.6% (2,768 jobs) below a peak the industry reached in 2012. In addition to these job losses, the sector saw average annual salary decline from $102,222 in 2012 to $93,118 in 2016 (-8.9%). However, salaries are up 3.5% in 2016 over 2015.

Austin has 6.3% more high tech trade jobs in 2016 than it had in 2006 while jobs in the sector nationally have grown by nearly 30%. The driver of job growth nationally is electronic shopping. This industry has grown 222% over the decade while computer and software merchant wholesaler jobs have declined by 10%. As of 2016, electronic shopping accounts for more jobs nationally than computer and software merchant wholesalers. In Austin, electronic shopping represents only 2,033 jobs, but growth over the decade was 370% and growth over the last year was 26%.
Austin is highly concentrated in high tech trade. Austin has almost 7 times the national concentration of jobs in this group and has 10 times the national concentration for jobs in computer and software merchant wholesaling.
Architectural and engineering services (1,161 firms), environmental consulting services (93), scientific R&D services (223), and medical and diagnostic laboratories (68) round out the remainder of the high tech sector and employed 21,226 in 2016, down 0.4% from 2015 but up 5.8% since 2011. Architectural and engineering services employs 14,172 of the total while scientific R&D employs 4,296. Austin’s LQ for engineering, R&D, and labs/testing is 1.2.
An Excel file of TWC data for Austin MSA establishments, firms, employment, and payrolls data for 2005-2016 for all of the high tech industry classifications referenced above, plus data for all other industry classifications up to at least the 3-digit NAICS[iv] level is here. The sheets in this file open on each sheet’s high tech summary table (rows 173-210). Scroll above that table to see data for other industries in order by NAICS (rows 4-171).

FOOTNOTES:
[i] QCEW estimates are derived primarily from the reporting of private business and government agencies under the unemployment insurance program. While all states produce similar data from the program, how much of the data different states publish in terms of industry detail, periods published, and geographic regions reported varies considerably. The U.S. Bureau of Labor Statistics (BLS) also produces a database of QCEW data for all U.S. counties, metros and states, however, the level of industry detail available is often more limited than desirable for estimating the tech sector. The BLS publication schedule also lags TWC’s updates and all references to national data for 2016 here are based on the first three quarters of the year.
[ii] Industry LQs are calculated by comparing the industry’s share of regional employment with its share of national employment. High tech manufacturing represents 3.2% of jobs in the Austin MSA, compared to 1.7% nationally. 3.2 divided by 1.7 yields a LQ of 1.9.
[iii] Computer systems design and related services (NAICS 5415) includes custom computer programming services (19,115 jobs), computer systems design services (12,364 jobs), computer facilites management services (245 jobs), and other computer related services (763 jobs).
Related Categories: Central Texas Economy in Perspective