Business Dynamics Statistics – Firm Startups & Related Measures
Posted on 05/09/2017 by Beverly Kerr
- New businesses formed in the Austin metro reached a new peak at 3,469 in 2014.
- Austin’s startup density, 179 per 100,000 population, is 141% of the national rate, and ranks 5th among the 50 largest metros.
- While Austin outperforms nearly all metro economies, it is not isolated from the long term downward trend in the business formation rate seen nationally over the last few decades.
One of 2016’s most important business climate rankings, the Kauffman Foundation’s Startup Activity Index, named Austin first among the top 40 U.S. metros for entrepreneurial activity and startup density. The contributions that Kauffman Foundation researchers have made to developing rigorous measures of entrepreneurial ecosystem vitality are highly regarded.
The Kauffman Startup Activity Index employs measures from two different Census Bureau surveys. The Current Population Survey yields data on the rate of new entrepreneurs and the share of entrepreneurs who are driven by opportunity (rather than necessity). The Business Dynamics Statistics (BDS) program produces data on new employer startup businesses. Since the publication of the latest Kauffman Index in August, a new year of data for U.S. metros has been produced by the BDS program.[1]
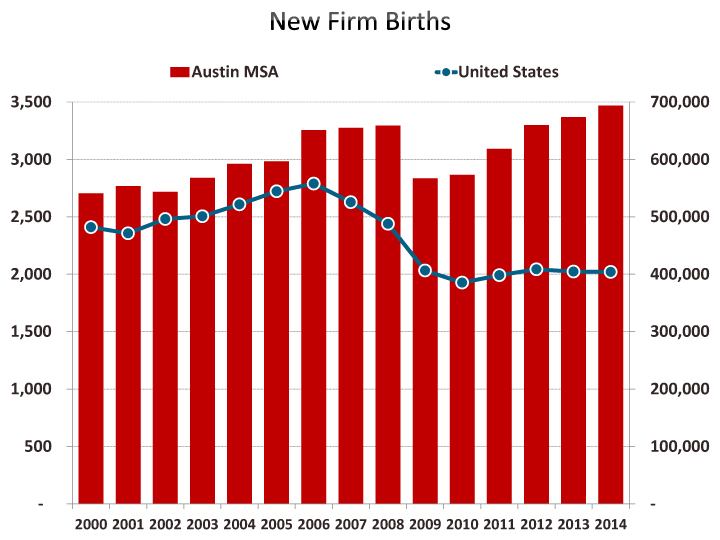
New business formation in Austin climbed to 3,469 in 2014, exceeding 2013 by 3.0%. Nationally, 403,902 new firms formed in 2014, down by 0.1% from 2013. The number of new U.S. firms created annually has not regained pre-recession levels—2014 is 27.6% below the peak attained in 2006 (557,843). However, Austin’s number of new firms grew each of the last five years and 2012, 2013 and 2014 exceed Austin’s previous peak of 3,295 in 2008. While the last recession caused negative startup growth in Austin in only 2009 (down 14.0%), the number declined in four successive years nationally.
Almost half (49%) of all metros saw an increase in business creation in 2014, compared to 40% of metros in 2013. Among the 50 largest metros, 60% saw an increase in business creation in 2014, compared to 36% of large metros in 2013.
Austin ranks 23rd among 366 metropolitan areas for number of new businesses created in 2014, a position significantly higher than where the metro ranks based on the size of its population (32nd) or its economy (also 32nd).
While new businesses formed in the Austin metro reached a new peak at 3,469 in 2014, current levels in Texas’ other major metros range from 6% to 13% below each’s pre-recession peak.[2] Growth in 2014 was 4.4% in San Antonio and 2.1% in Dallas-Ft. Worth, while Houston saw fewer new firms in 2014 (-0.2%).

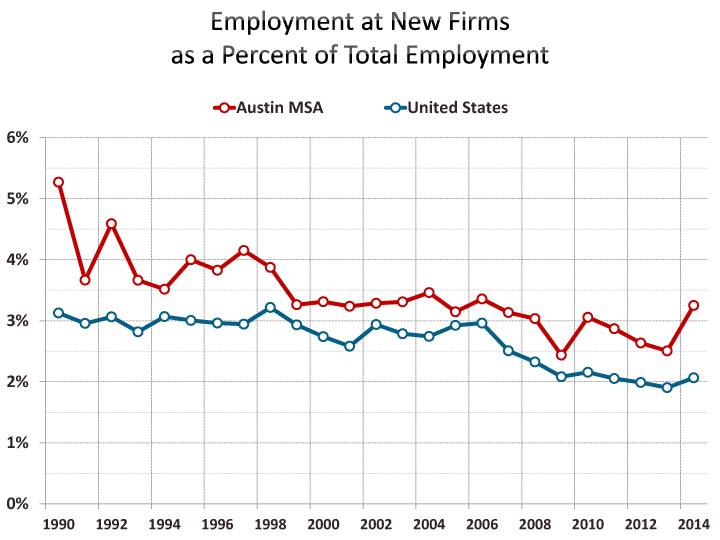
Although the number of business starts could be said to have recovered in Austin by 2012, on a per capita basis, new firms are not yet forming at the rate they were before the recession. Austin saw over 200 new businesses per 100,000 population each year from 1977 to 2008, except 1980. These 200-plus rates even applied following the 2001 “dot com” recession which hit Austin harder than much of the rest of the country. By 2012, the rate in Austin climbed up to 180 per 100,000 population after falling to 166 in 2010, and has held just under that at 179 for the last two years. Austin’s current rate of business formation is about 16% below the average (212) seen in Austin over the pre-recession decade (1998-2007). Nationally, 127 new businesses formed per 100,000 population in 2014, which is 28% lower than the annual average of 177 seen over the decade before the recession.
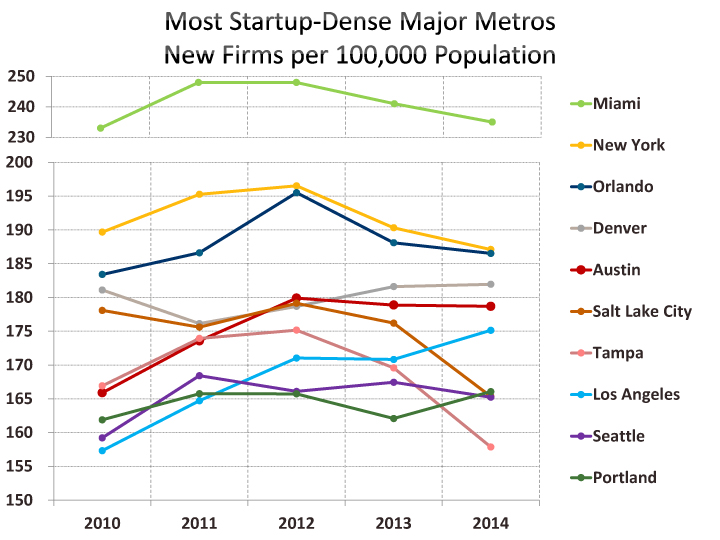
Over the pre-recession decade, the rate of business formation in Austin averaged 120% of the national rate, but in 2014, Austin’s startup density is 141% of the national rate. The Raleigh, San Jose, and San Francisco metros, also traditionally recognized hotbeds of startup and venture capital activity, each have lower rates of business formation (153, 161, and 171 per 100,000 population respectively in 2014), than Austin. As the graph above indicates, Austin has the fifth greatest startup density among the 50 largest metros.
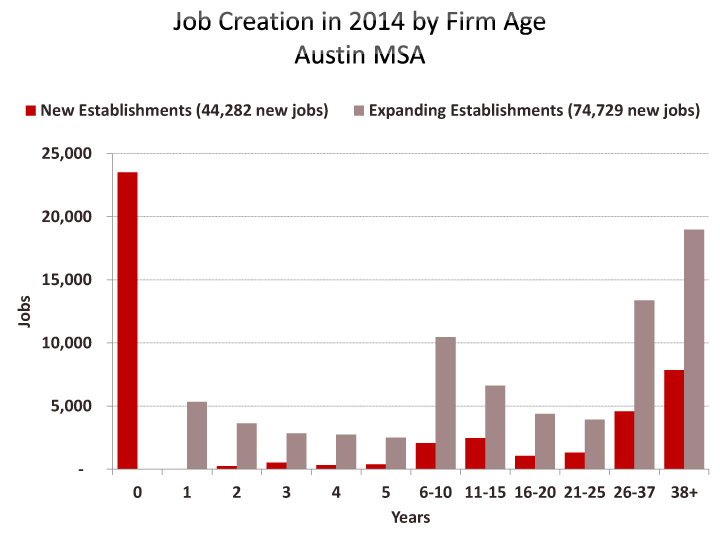
In the Austin metro in 2014, new establishments created 44,282 jobs and these new establishments included both startups (firms less than 1 year old) and new establishments of existing firms of varying ages. Expansions at existing establishments created another 74,729 jobs.

Startups accounted for 23,518 or 53% of the 44,282 new establishment jobs created in 2014. That rate is higher than the longer range averages—the average over the last five years was 47%, over the last decade the average was 44%, and the average over the decade preceding the recession was 43%.
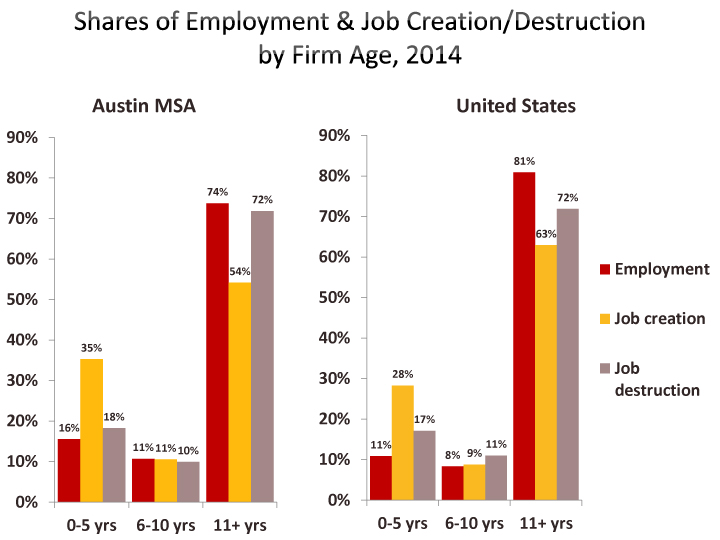
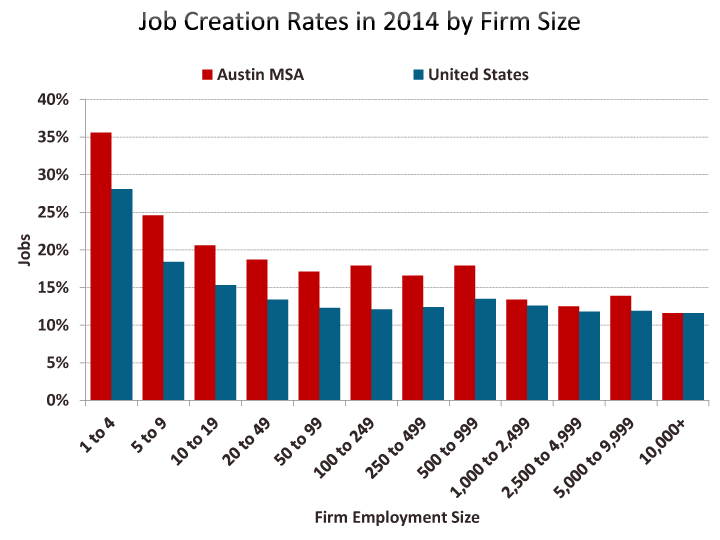
The share of employment in new and young firms is also a key startup density measure. New and young firms account for a larger share of job creation than they do of employment and as the graph above illustrates, in Austin, they account for greater shares of both employment and job creation than they do in the nation as a whole.
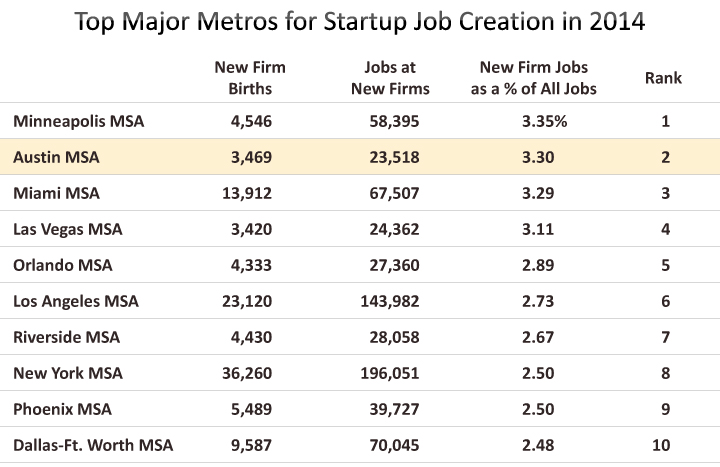
In 2014, 3,469 startups accounted for 23,518 new jobs, representing 3.3% of all jobs in the metro. The share was 2.5% in 2013. Among the 50 largest metros, Austin ranked second behind Minneapolis for the percent of jobs created by startups.
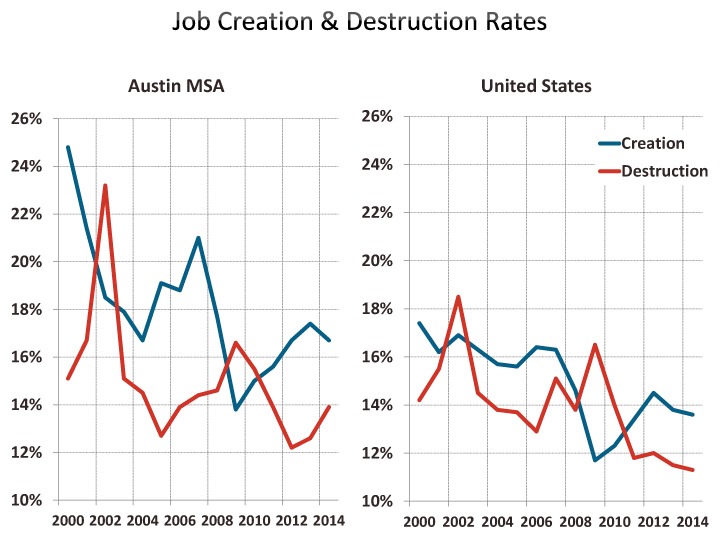
Each perspective on business entry and job creation provided in the BDS dataset is also available for business exits and job destruction. In 2014, 3,616 establishments exited in Austin, representing 8.9% of businesses. This is the lowest exit rate since 1979. Nationally, the exit rate is even lower, 8.6%, and that rate is the lowest since data begins in 1977.

For new businesses, close to a quarter exit within their first year. The exit rate for 1-year old firms is 23.8% in Austin in 2014, compared to 25.5% nationally.

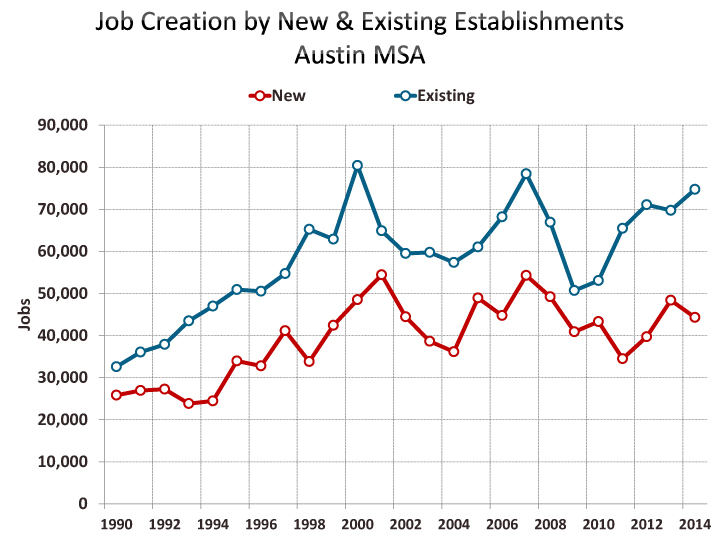
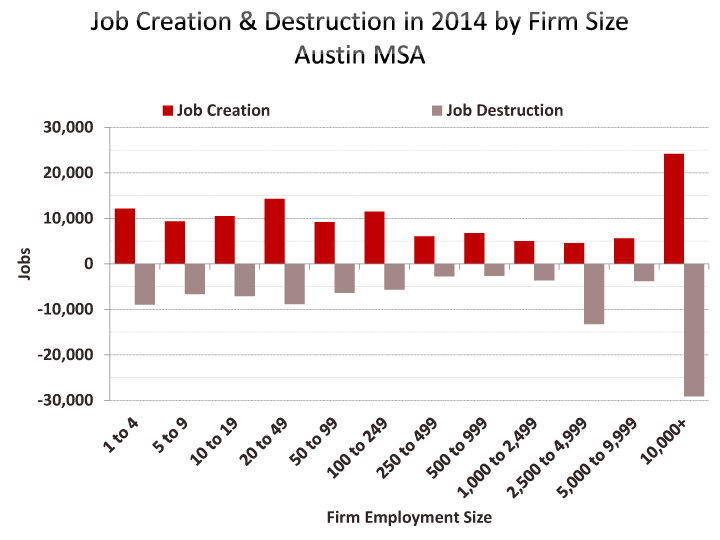
The graph below summarizes jobs created by new businesses and continuing businesses and jobs destroyed by businesses closing and continuing businesses laying off jobs in Austin.
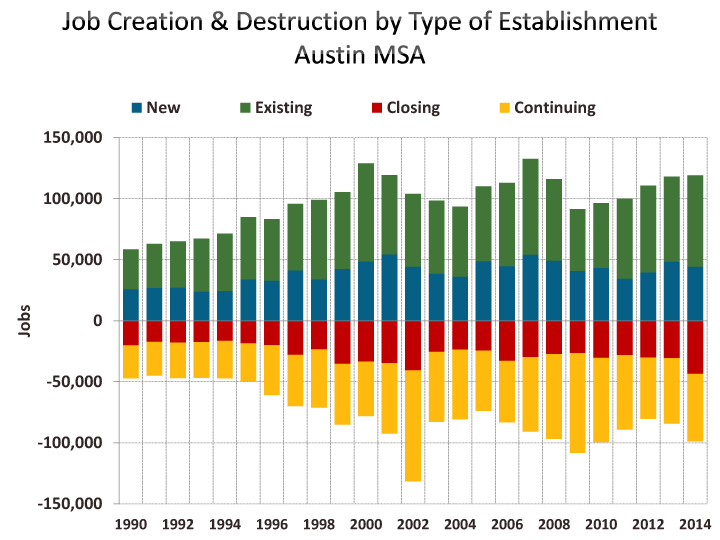
In Austin in 2014, 119,011 jobs were created—44,282 by new businesses and 74,729 by continuing existing businesses. At the same time, 98,847 jobs were destroyed—43,451 by businesses closing and 55,396 as layoffs by continuing businesses. The net result is positive net job creation of 20,164 in 2014.

The following graphs illustrate shares of employment and job creation by firm size and also disaggregate job creation by firm size for new and for expanding establishments.


[1] The BDS program has become an important tool providing insights about business formation and growth, labor market dynamics, and other features of the economy crucial to understanding current and historical U.S. entrepreneurial activity. The latest release of new data is only the fourth time that the program has provided such data by metropolitan statistical area.
BDS is the gold standard of business creation data. It is based on the Census Bureau’s Longitudinal Business Database of the universe of employer companies (not a sample survey) and tracks economic activity at both the firm and establishment level over a long period of time. BDS tracks the annual number of new businesses (startups and new locations), and, by firm age and size, tracks creation and destruction of jobs at the establishment level, providing a picture of the dynamics underlying aggregate net growth in employment.
[2] That is, peaks reached in the decade immediately preceding the last recession and excluding peaks of the 1980s.
Related Categories: Central Texas Economy in Perspective