Poverty, Income, & Health Insurance
Posted on 02/21/2017 by Chris Ramser
- The Austin MSA poverty rate improved to 11.7% in 2015 down from 15.1% in 2014.
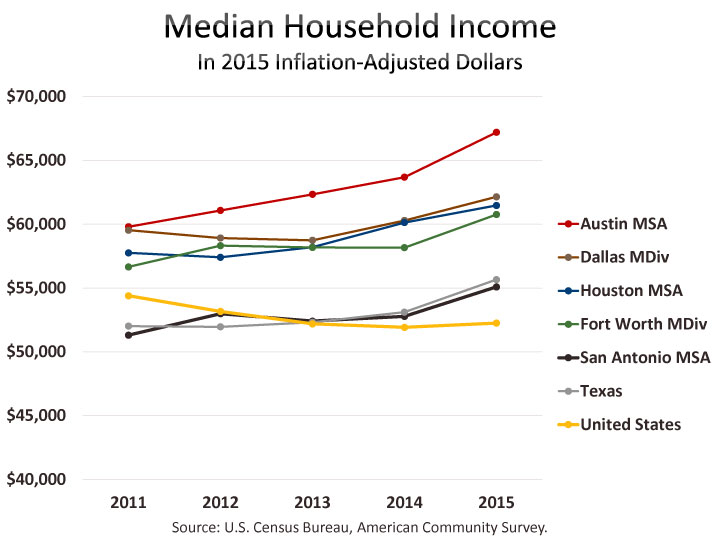
- Austin’s median household income remains higher than other Texas major metros. It improved by 5.5% in 2015 from $63,680 to $67,195 (inflation-adjusted dollars).
- 12.9% of Austin's civilian non-institutionalized population remained uncovered by health insurance in 2015.That is down 26% from 2013.
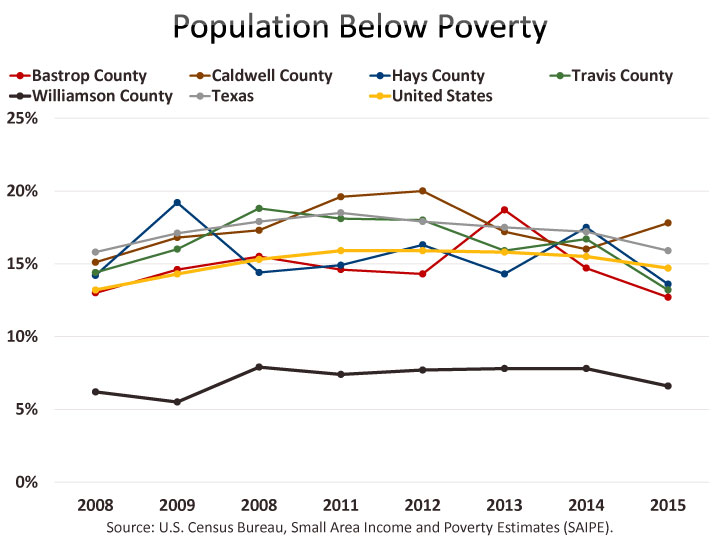
Data released in December 2016 by the Small Area Income Poverty Estimates (SAIPE) generally confirm a previously observed trend of declining poverty rates in the Austin region for 2015 that was previously reported by the Austin Business Journal. Four out of five counties within the Austin MSA had poverty rates decline from 2014 to 2015, while Caldwell’s slight increase was within the margin of error for the survey.[1] Overall, the poverty rate for the Austin region declined to 11.7% from 15.1% in 2014, which is a statistically significant drop[2]. Texas and the U.S. also saw a statistically significant decline in the poverty rate from 2014 to 2015. The rate in the U.S., 14.7% was down from 15.5%; while Texas was at 15.9% down from 17.2%. [See Addendum] for additional poverty rates by age including childhood poverty trend.

The SAIPE December release expands on the poverty estimates previously released by the American Community Survey (ACS) last September by producing reliable estimates at the school district and county level. Williamson County had the lowest poverty rate in the region at 6.6%, while Caldwell had the highest at 17.8%. Although, Caldwell’s 2015 rate was higher than the data for 2014, the increase was within the Caldwell’s margin of error (MOE) of 2.8%. The estimate in Bastrop was 12.7%, while Travis and Hays were 13.2% and 13.6%, respectively.

Poverty rates at the sub county are only available as an average of the data collected through the ACS over the last five years. This data, also released in December, shows that the higher poverty rates in the region generally are along and to the East of I-35. The map below depicts the poverty rate at the Census block group level. The lightest shade on the map represents areas with a poverty rate estimated at or below the Austin MSA’s rate over the same period of 2011-2015, which was 14.2%.

Among Texas’ major metros, the poverty rate estimate is lowest in Austin at 11.7%, however, due to the survey’s margin of error, the actual value may be between 10.9% and 12.5%. Fort Worth’s estimate of 12.8% had an MOE range of 12.0% to 12.8% that encompasses the Austin estimate. Dallas was estimated at 13.6% followed by Houston and San Antonio both at 14.6%.

The poverty rate estimates population with family or personal income below the poverty threshold, but the Census also produces an income-to-poverty ratio that represents the depth of poverty for those with income below the threshold and the proximity to poverty for those with income below the threshold. Families and individuals who are identified as in poverty have an income-to-poverty ratio of less than 100%.

Income
In addition to providing poverty rates, the Census Bureau’s ACS also publishes a variety of income data. The Austin MSA’s 2015 median household income was $67,195 and exceeded all Texas’ other metros, except Midland ($80,761). Among Texas major metros, median household incomes are 8 to 10% lower in Dallas, Houston and Fort Worth, and 22% lower in San Antonio. Median household income is $55,653 in Texas in 2015, while the national median is only slightly higher at $55,775.

Thus, Austin’s 2015 median household income is $67,195, plus or minus $1,310. The vertical bars in the table above indicate the MOE for each estimate.

Estimates indicate that Austin’s median household income gained an inflation-adjusted 5.5% from 2014. This gain was noticeably higher than the 2.1 to 2.2% growth that Austin saw each year from 2012 to 2014. Median household income grew 3.8% nationally and 4.8% in Texas between 2014 and 2015. As with the poverty estimates themselves, the median household income also has a margin of error. For 2014-2015, the MOE was such that the increase was statistically significant for the Austin MSA, Texas and the U.S.
Income Inequality
The Census Bureau’s data on income includes a standard measure of income inequality. The Gini index summarizes the distribution of income across the entire income distribution in an area. The Gini index varies from 0 to 1 where 0 indicates perfect equality, where there is a proportional distribution of income, and 1 indicates perfect inequality, where one household has all the income and all others have no income. On this scale, San Antonio, Fort Worth, Austin, and Dallas have lower estimated Gini indexes than the U.S. index of 0.4817, while Houston and Texas as a whole have higher Gini indexes. Among the 50 largest metros in the U.S., Austin’s 0.4677 Gini index ranks as the 25th lowest. Salt Lake City has the lowest Gini index (0.4264) among large metros and New York and Miami has the highest (0.5163).

As the graph below indicates, the U.S. Gini index has been trending upward since 2010. Austin’s estimates appear to indicate a downward trend, however the margin of error is such that this does not indicate a statistically significant difference between 2011 and 2015.

Health Insurance
While Texas leads among states for the percent of the civilian noninstitutionalized population without health insurance—17.1% compared to the national rate of 9.4%—Austin residents fare better in 2015.

In the Austin metro, 12.9% (+/- 0.6) lack health insurance coverage and this rate has been declining over the last several years. Among the civilian employed population over the age of 18, 14.4% lack health insurance in Austin in 2015, versus 11.0% nationally and 19.5% in Texas. Since 2013, rates of uninsured are down 35% in the U.S., 26% in Austin, and 23% in Texas.

As for type of coverage, Austin MSA’s residents tend to be covered by private insurance either from their employer or by direct purchase at rates higher than Texas and U.S., while Texas and the U.S. show higher shares of insured on medicare and medicaid plans. In Austin, 74.2% of the civilian noninstitutionalized population is covered by a private plan, while 21.2% are covered by a public plan. Rates for these in Texas are 62.3% with private and 29.0% with public insurance, and 67.5% and 34.7% in the U.S. Because individuals may be covered by mulitple plans, the percentages of insured and unisured add to over 100%.

If you’d like to examine additional data provided by the ACS, these are two files [Profile or Trend] presenting basic demographic tables and basic trend tables for the Austin MSA, Texas, and the U.S. Note that the Census Bureau omits MOE numbers from their Trend tables, and for the sake of simplifying this file of Profile tables, MOE columns have been omitted.
A large volume of additional ACS tables and data is available via the Census Bureau’s Fact Finder interactive application.
FOOTNOTES:
[1] It should be noted that estimates from the American Community Survey (ACS) and the Small Area Income Poverty Estimates (SAIPE) are subject to sampling error and margins of error (MOE) are provided for each estimate.
[2] Considering the MOE helps avoid misinterpreting small differences between estimates as significant. The Census Bureau publishes MOEs at the 90% confidence level. The confidence interval is calculated using the MOE. The MOE is added and subtracted from the sample estimate to obtain two numbers representing the confidence interval. The confidence interval is the range of values that is expected to contain the average value of the statistic. MOEs at a 90% confidence level imply a 10% chance of incorrect inference for the estimates. A statistically significant change would be observed when the estimate for the current time period is either higher or lower than the margin of error for the pervious time period.
Top
[Addendum] :
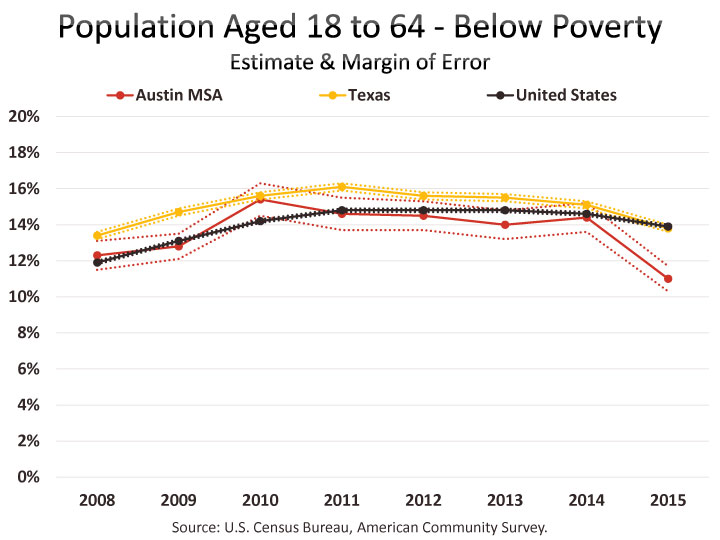
Here are some additional graphs of the poverty rate by age for the Austin MSA, Texas, and U.S.


Top
Related Categories: Central Texas Economy in Perspective