Venture Capital
Sign up for the Central Texas Economy Report newsletter
Posted on 02/11/2020 by Beverly Kerr
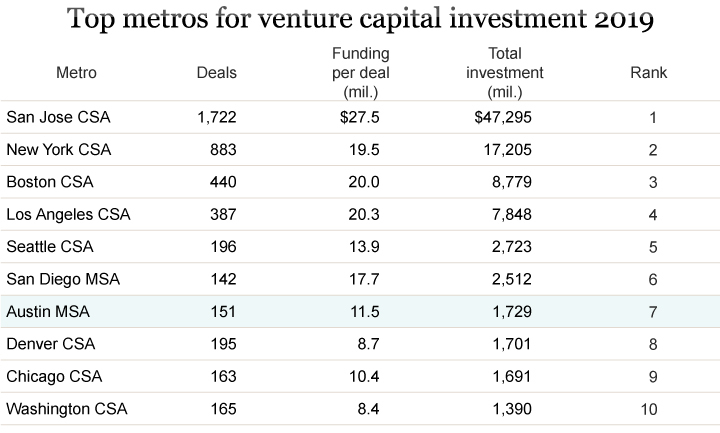
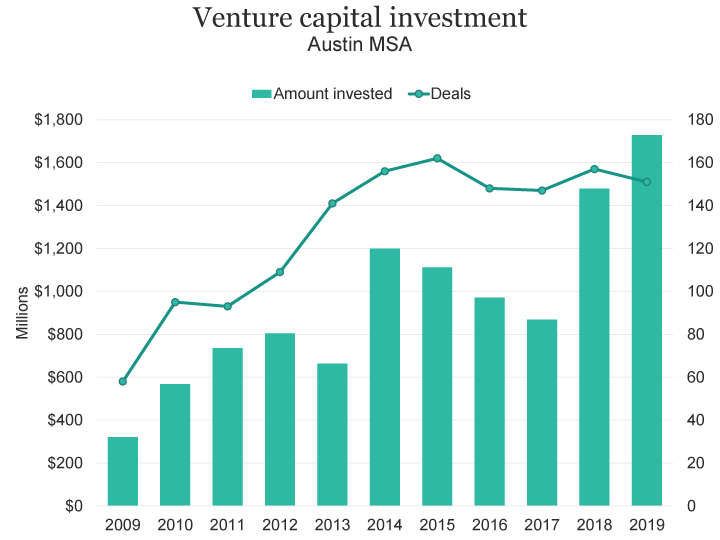
- Venture capital funding invested in 151 Austin area companies in 2019 totaled over $1,729 million, up 17% over 2018.
- Average investment per deal was $11.45 million in Austin, up 22% over 2018.
- Austin ranks 7th among U.S. metros for venture capital investing in 2019.
Over 150 Austin companies attracted $1,729 million in venture capital (VC) investment 2019. That is 16.9% higher than 2018 ($1,479 million). This year’s funding of Austin companies topped all previous years except 2000.[1] Nationally, VC investment is down 8.8% from 2018.
The total value of investing in Austin ranks 7thamong U.S. metros in 2019.[2]
What follows examines 2019 and trends over the last decade based on recently released year-end data from the The PwC MoneyTree™ Report by PwC and CB Insights.[3] It should be noted that, just weeks into the year, Austin’s strong performance in 2019 appears to be continuing into 2020. In January, two of the most robust deals are $90 million going to Vapor IO and $60 million raised by FlashParking.
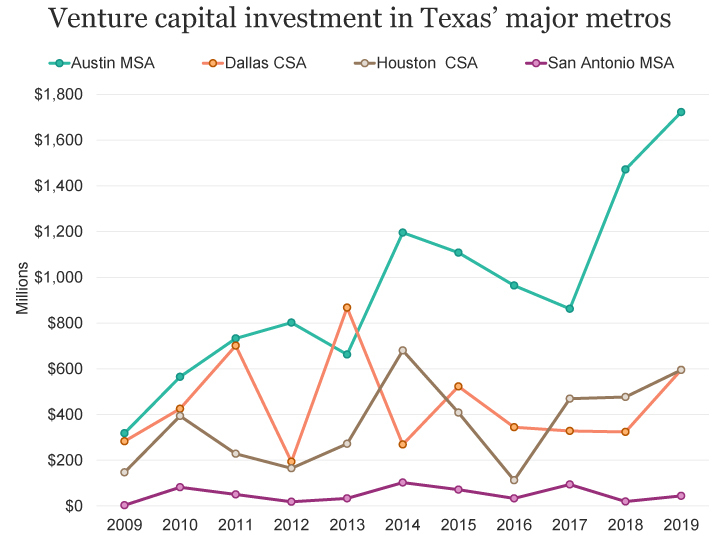
Austin took the majority of VC investing in Texas in 2019—58.0%. That’s on par with the last 5 years (57.8%). The 5 years before that (2010-14), Austin’s share was 46.5%.
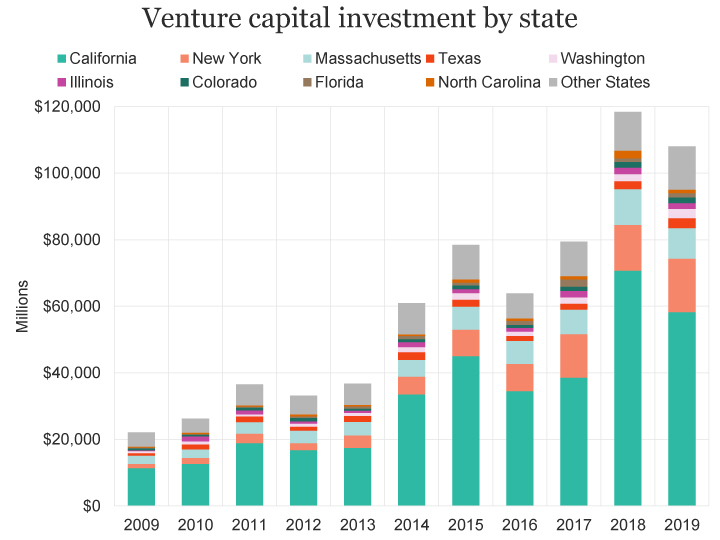
VC investing in Texas accounted for 2.8% of total investment in 2019 and 2.4% over the last 5 years. However, the state took in 4.4% of the total over 2010-14 and 4.7% over 2005-09. Similarly, Austin accounts for 1.6% of VC dollars in 2019 and 1.4% over the last 5 years, but in the preceding decade, Austin took more than 2% of all funding (2.1% over 2010-14 and 2.2% over 2005-09).

Austin’s and Texas’ contracted shares of total investment are impacted by the relative performances of California and New York over the last decade. Already accounting for more than half of 2010-14 funding, California garnered 149% more funding over 2015-19. For New York companies, funding over the last 5 years was 272% higher than the preceding 5 years. For all U.S. states excluding California and New York, VC funding over the last 5 years was 81% higher than the total for the preceding 5 years. Texas, in contrast, garnered only 25% more dollars over the last 5 years than it did over the preceding 5 years. Austin’s 2015-19 is 55% ahead of 2010-14.

Funding per deal
In 2019, 151 Austin companies took in an average of $11.5 million each. That level of funding per deal is 21.5% higher than 2018 ($9.4). This year’s average deal size is larger than any other year except 2000 and 2005. Austin’s funding per deal in 2019 is about 63% of the national average of $18.3 million—better than the 56% average national deal size seen over the last 5 years. However, for 5 years before that, 2010-14, Austin’s average deal size was 82% of the national average.
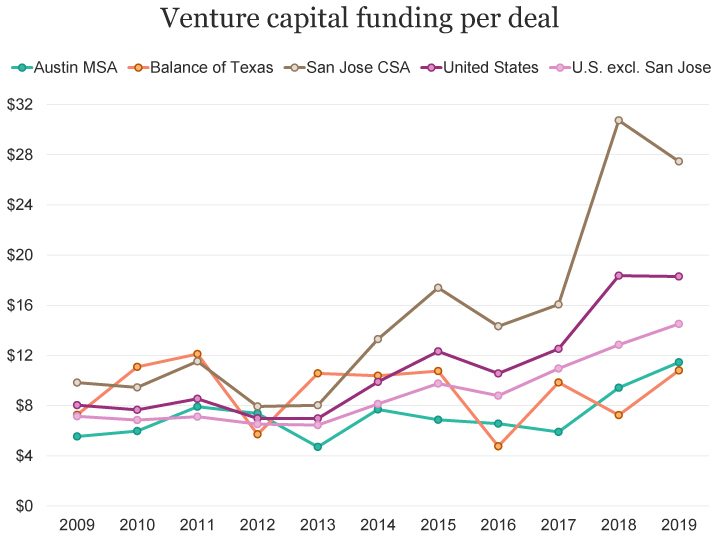
The difference in average deal size between Austin and the nation has much to do with the extraordinary deal size level of the San Jose CSA ($27.5 million) in 2019. Companies in the San Jose CSA took in 44% of all funding in 2019. Average funding per U.S. deal outside of the Bay Area in 2019 was $14.5.
Investment by sector
Internet companies dominated investments in Austin in 2019. Seventy-two deals in this sector accounted for $818.3 million or 41.3% of total funding.


Software (non-internet/mobile) was the second largest sector by value ($453.7 million in 21 deals) in 2019. Mobile and telecommunications was 2019’s third most funded sector ($129.6 million in 13 deals) in Austin.
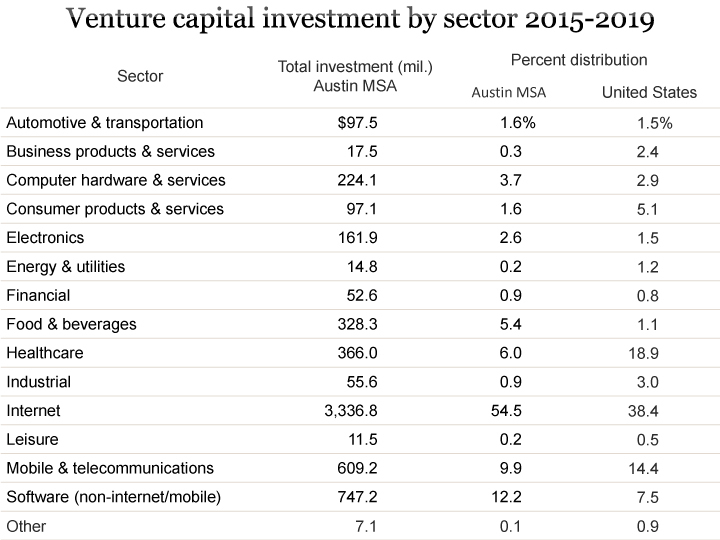
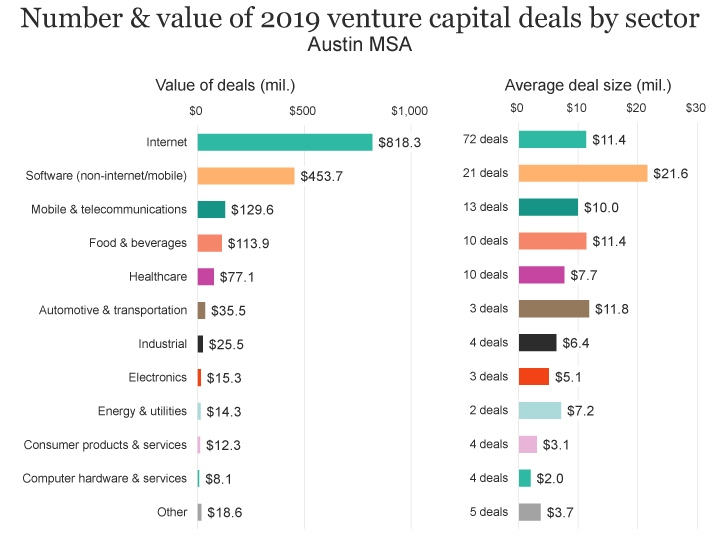
Internet companies dominate VC investing nationally as well as in Austin. Over the last 5 years, internet companies have attracted 54.5% of funding in Austin and 38.4% of funding nationally. In Austin, funding of internet companies declined 7.9% from 2018 to 2019. Nationally, the sector’s funding rose 15.6% in 2019. In 2019, funding per internet deal was $11.4 million in Austin compared to $17.6 million nationally. Funding per deal in 2019 was up by 6.2% in Austin and 29.7% nationally, over 2018.

Together, the 5 information technology-related sectors account for 83% of the value of investing in Austin companies over the last year and also over the last 5 years. Nationally, IT-related sectors account for 65% of both 2019 funding and 2015-19 funding.

Investment by round
Of 2019’s 151 Austin area deals, 38 are classified as seed/angel stage, 36 are early stage (Series A), 40 are expansion stage (Series B and C), 7 are later stage (Series D and Series E+), 4 are growth equity, 5 are convertible note, and 21 are “other.”

Investment in Austin companies over the last 5 has been dominated by expansion stage company deals (35% for 2015-2019). With a 53% increase in expansion stage investment in 2019 over 2018, these deals accounted for 44% of all investment in 2019. The value of later stage deals increased by 42% in 2019 and this round accounted for 24% of funding in 2019, compared to 20% over 2015-19.

Seed and early stage companies accounted for 49% of funded companies in 2019 and 52% over the last 5 years. Dollars going to these deals accounted for 22% of funding in 2019, compared to 25% over the 2015-19. Austin’s largest seed stage deal in 2019 was a $12.2 million investment in Pensa Systems. The company builds predictive technology for retailer shelf space to help with inventory controlling utilizing AI and small flying drones with cameras. Another large seed round investment, $10.1 million, went to Reliant Immune Diagnostics (MDBox).

Nationally, seed stage and early stage funding accounts for 18.6% of total funding in 2019 and 18.7% over the last 5 years. Expansion stage accounts for 33.1% of total funding in 2019 and 31.7% over the last 5 years. Later stage accounts for 32.7% of total funding in 2019 and 30.8% over the last 5 years.

The Chamber’s Economic Indicators page provides an up-to-date historical spreadsheet of venture capital data for Austin, Texas and the U.S.
FOOTNOTES:
- In 2000, the peak before the dot-com bubble burst, $2,724 million flowed to Austin startups. ↩
- MoneyTree’s regional data uses the U.S. Office of Management & Budget’s delineations of Consolidated Statistical Areas (CSAs) and Metropolitan Statistical Areas (MSAs). A CSA is an area composed of adjacent metropolitan and micropolitan statistical areas. For example, the San Jose-San Francisco-Oakland CSA includes the San Jose-Sunnyvale-Santa Clara MSA, the San Francisco-Oakland-Berkeley MSA, and 5 other adjacent single-county MSAs (Napa, Santa Cruz-Watsonville, Santa Rosa, Stockton-Lodi, and Vallejo-Fairfield); and the Dallas-Fort Worth CSA includes the Dallas-Fort Worth-Arlington MSA and the Sherman-Dennison MSA. Not all MSAs are part of a larger CSA. While Austin and San Antonio are adjacent, there is not an Austin-San Antonio CSA. The Austin MSA is made up of Bastrop, Caldwell, Hays, Travis and Williamson Counties. ↩
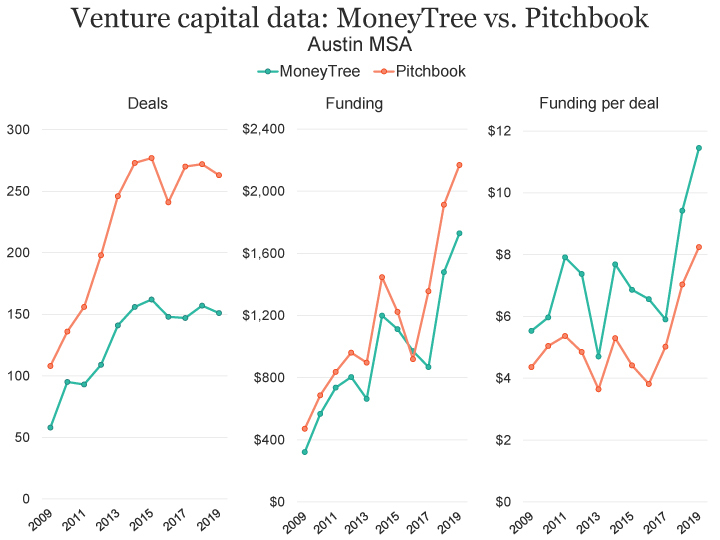
- For a detailed explanation of the investments represented in the PwC/CB Insights MoneyTree venture capital estimates, see the MoneyTree Definitions page. Note that an alternative set of venture capital estimates is Pitchbook-NVCA’s Venture Monitor. The following graph illustrates each publisher’s estimates for Austin ↩
Related Categories: Central Texas Economy in Perspective