Patent Activity
Posted on 01/11/2017 by Beverly Kerr
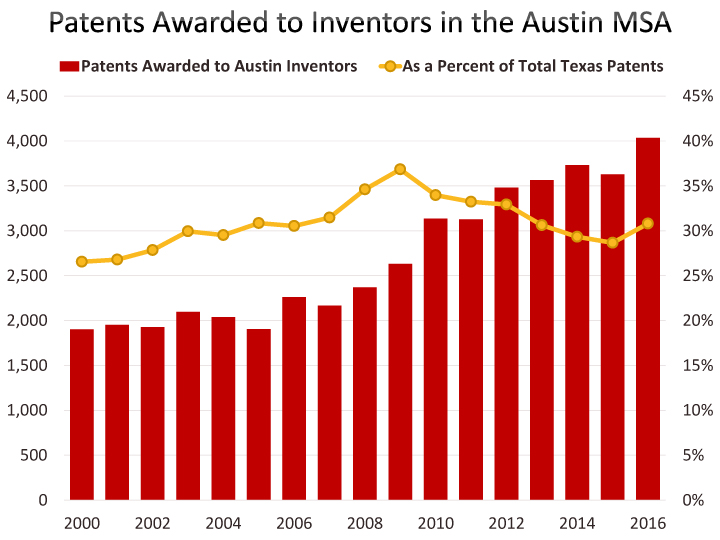
- Over 4,000 patents were awarded to Austin area inventors in 2016.
- Austin awards in 2016 were 11.2% higher than 2015.
- Austin garnered 30.8% of patents granted to Texas inventors in 2016, up from 28.7% in 2015.
Over 4,000 patents were awarded to Austin area inventors in 2016. Austin awards were 11.2% higher than 2015. The state saw a 3.5% increase in patents awarded. Total utility patents awarded by the U.S. Patent and Trademark Office (USPTO) were up 1.5% in 2016 over 2015.
Austin garnered 30.8% of patents granted to Texas inventors in 2016, up from 28.7% in 2015. Over the last decade, Austin residents were listed inventors on 31.8% of the over 100,000 patents awarded to Texas inventors.
The USPTO reports that intellectual property-intensive industries directly and indirectly support nearly one-third of all U.S. employment, over 38% of U.S. gross domestic product, and that workers in IP-intensive industries earn wages that are 46% higher than average wages in other industries. Patent activity is a primary indicator of Austin’s climate for innovation and is key to the region’s ability to sustain its competitive edge. Austin’s economic growth, exports, and job creation are uncommonly dependent on the concentration of high tech industries in our economy.[1]
The numbers above for the Austin metro area and Texas are based on the residence of one or more listed inventors on utility patents[2] issued using the USPTO Full-Text and Image Database. The USPTO also creates a wealth of convenient tabulations of utility patent awards by metropolitan region.
In these tabulations, patent origin is determined by the residence of the first-named inventor. Therefore, while the PTO database retrieves 3,628 patents credited to one or more Austin inventors in 2015, the PTO metropolitan area tabulations based on first-named inventor credit 2,700 of 2015 patent grants to Austin. Thus, these tabulations currently reflect about three quarters of all patents with Austin inventors.
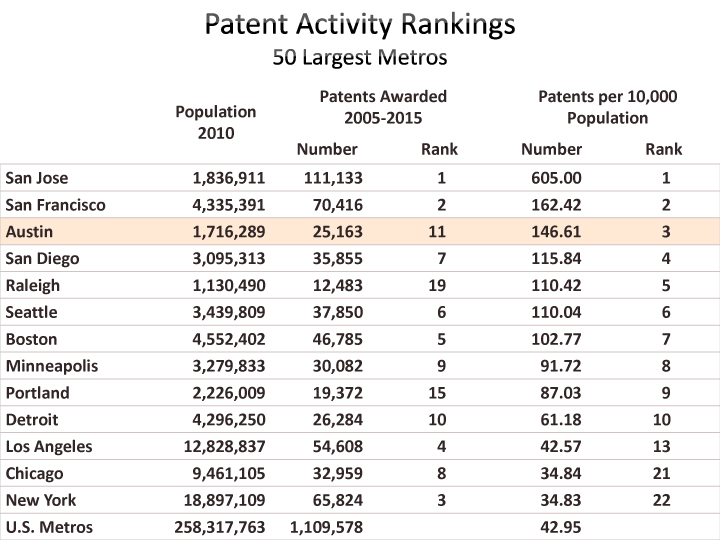
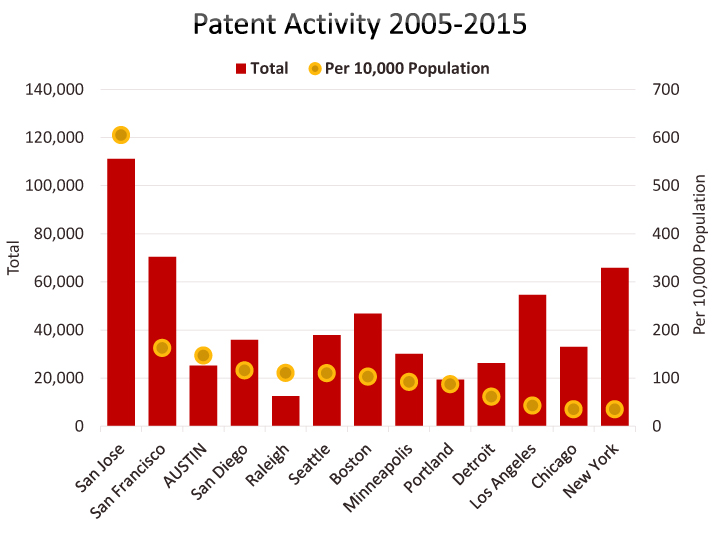
The table above and graph below compare patent activity in large metros over the last decade. Austin ranks eleventh for total patents awarded, however, on a per capita basis, Austin has the third highest level of patent activity. San Jose and San Francisco rank first and second by both measures.
Patents credited to Austin inventors are tabulated by the PTO by organization the patent is assigned to (there may be more than one assignee organization and the data reflects the first named assignee). The graph below shows the top private companies by number of patents awarded over the last five years. The table following compares the top assignee companies for the last five years to the top companies during the first five years of the previous decade.


It is important, especially in working with data over longer time spans, to be cognizant of company name variants, mergers and acquisitions, etc., in compiling time series, rankings, etc. For example, the AT&T totals in the table above are based on patents credited to eight different AT&T and Southwestern Bell entities over the time span of the PTO table. Legerity, a significant Austin patenting organization in the early 2000s, was acquired by Zarlink Semiconductor, which was acquired by Microsemi. Similar issues multiply as you wade through the 662 patenting organizations in the Austin table.
IBM is consistently the largest patenting organization in Austin. The only exception is the year 2000, when Advanced Micro Devices had a greater total. Austin has in the past been reported to garner more IBM patents than any IBM site but Yorktown Heights, the company’s largest research lab. The last time Austin had more IBM patents than the New York metro area was 2011. IBM patents credited to Austin inventors by the PTO have declined to about 52% of the number credited to the New York metro, however Austin continues to garner more than San Jose, the other major U.S. lab location (and also more than the several lab locations abroad). The Poughkeepsie metro outstripped Austin for IBM patents in 2014 and 2015. East Fishkill, in the Poughkeepsie metro, has long been a significant hub of IBM operations. However, GlobalFoundries acquired IBM’s microelectronics business and the Fishkill fab in 2015.

The University of Texas System is commonly ranked as one of the most globally significant institutions in patent rankings. The UT, as an assignee, is reported and is ranked as a single unit, rather than by campus, among patenting organizations. However, it is possible to separate UT patents by location out of the PTO metro tabulations based on address of first named inventor. On that basis, Austin accounts for 25% of all UT patents during 2011-2015, slightly less than the numbers credited to Dallas-Ft. Worth and Houston inventors. However, Austin’s patent share has grown significantly over the last five years and in 2015, Austin accounts for more patents (57 of 189 UT patents attributed to U.S. inventors) than the other major Texas metros.
Patent technology classification is another avenue for analyzing patent activity across metropolitan areas. Unfortunately, patent technology classes are highly “technical.” That is, it is difficult to readily assign many of them to industries or categories like “life sciences,” “renewable energy,” “semiconductors,” etc. The PTO has a publication that arranges the U.S. classification system by “related subject matter,” but this only partially satisfies.

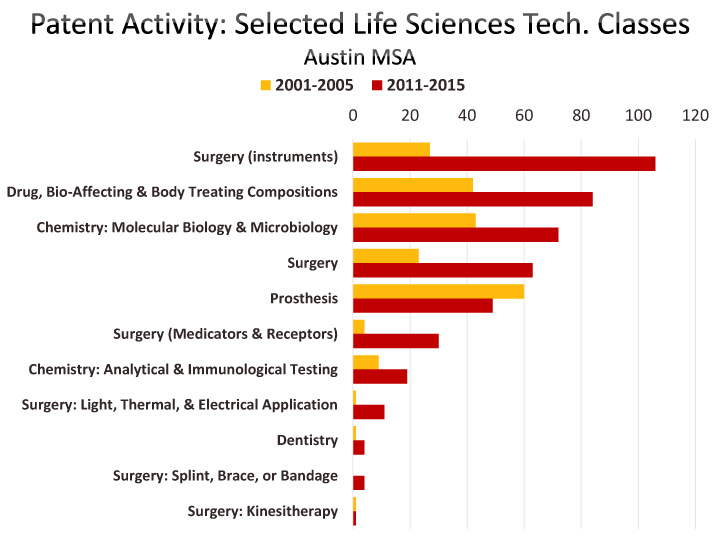
The graph above and table below compare patent activity in the top technology classes in Austin over the last five years to the first five years of the previous decade.
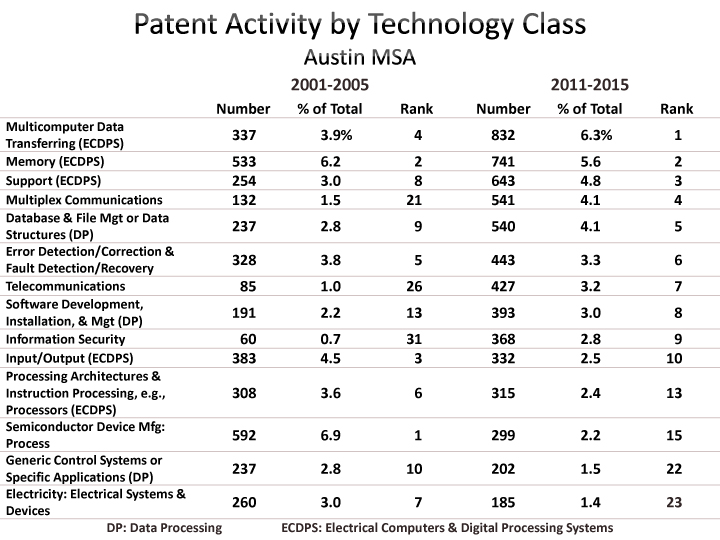
Among the larger patent classes in Austin, “Semiconductor Device Manufacturing: Process” has seen the greatest decline in patents issued. Over 2001-2005, this was Austin’s No. 1 class and Austin accounted for 5.1% of the class’s patent awards in U.S. metros. Now the class accounts for only 2.9% and more patents are awarded in 14 other classes in Austin. Austin was the fifth most significant patenting metro in the first period and ranks 11th in the later period. While the top ranking metros in the two periods overlap significantly, the standout difference is the Albany metro. Albany garnered 39 patents in this class in 2001-2005 and 660 in 2011-2015. You may recall New York’s aggressive effort to create a significant nanotech/semiconductor industry cluster included inducing SEMATECH to relocate its headquarters from Austin to Albany in 2007.

“Multicomputer Data Transferring (ECDPS)” and “Memory (ECDPS)” are Austin’s two most significant patent classes for 2011-2015 and they were also among the most significant in 2001-2005. Austin accounted for 6.5% of U.S. metros’ activity in Multicomputer Data Transferring in 2001-2005, ranking fourth, and 4.3% in 2011-2015, ranking sixth. Austin ranked second among U.S. metros for Memory patents in both periods, but Austin’s share dropped from 12.3% to 9.8%.


The PTO aggregates about 25 technology classes into a “Calculators, Computers, or Data Processing Systems” grouping in their 2012 publication referenced above on the patent classification scheme. This grouping accounts for 46% of all patent awards to Austin inventors since 2000. For 2001-2005 the grouping made up 42% of Austin patents (3,608 of 8,533 total patents) and the share increased to 49% for 2011-2015 (6,455 of 13,297 total patents).
A smaller but growing “life sciences” grouping made up of what the PTO calls “body treatment and care” plus selected classes under “life and agricultural sciences and testing methods” shows significant growth (210%) in Austin between 2001-2005 (211 patents) and 2011-2015 (443 patents). Note that “life sciences” is an area where thorny classification issues arise and these numbers reflect a limited definition (classes under the “measuring, testing, precision instruments” grouping, among others, could also be relevant).
The PTO reports that, as of 2015, the average number of months to obtain a patent is 26.6. In 2016, the PTO opened regional offices in Dallas and San Jose; Detroit and Denver offices opened in 2012 and 2014 respectively. These regional hubs offer inventors and entrepreneurs new services, more examiners, and are expected to optimize patent quality and timliness.
Footnotes:
[1] The latest Best Performing Cities report from the Milken Institute ranks Austin ninth among large metros for high-tech GDP concentration.
[2] Issued for the invention of a new and useful process, machine, manufacture, or composition of matter, or a new and useful improvement thereof, it generally permits its owner to exclude others from making, using, or selling the invention for a period of up to twenty years from the date of patent application filing, subject to the payment of maintenance fees. Approximately 90% of the patent documents issued by the USPTO in recent years have been utility patents, also referred to as "patents for invention". Other patent types include design patents (issued for a new, original, and ornamental design embodied in or applied to an article of manufacture) and plant patents (Issued for a new and distinct, invented or discovered asexually reproduced plant).
The Chamber’s Economic Indicators page provides up-to-date historical spreadsheet versions of Austin, Texas and U.S. data for some of the patent activity data addressed above.
Related Categories: Central Texas Economy in Perspective