Business Dynamics Statistics – firm startups & related measures
Posted on 11/08/2022 by Beverly Kerr
Sign up for the Central Texas Economy Report newsletter
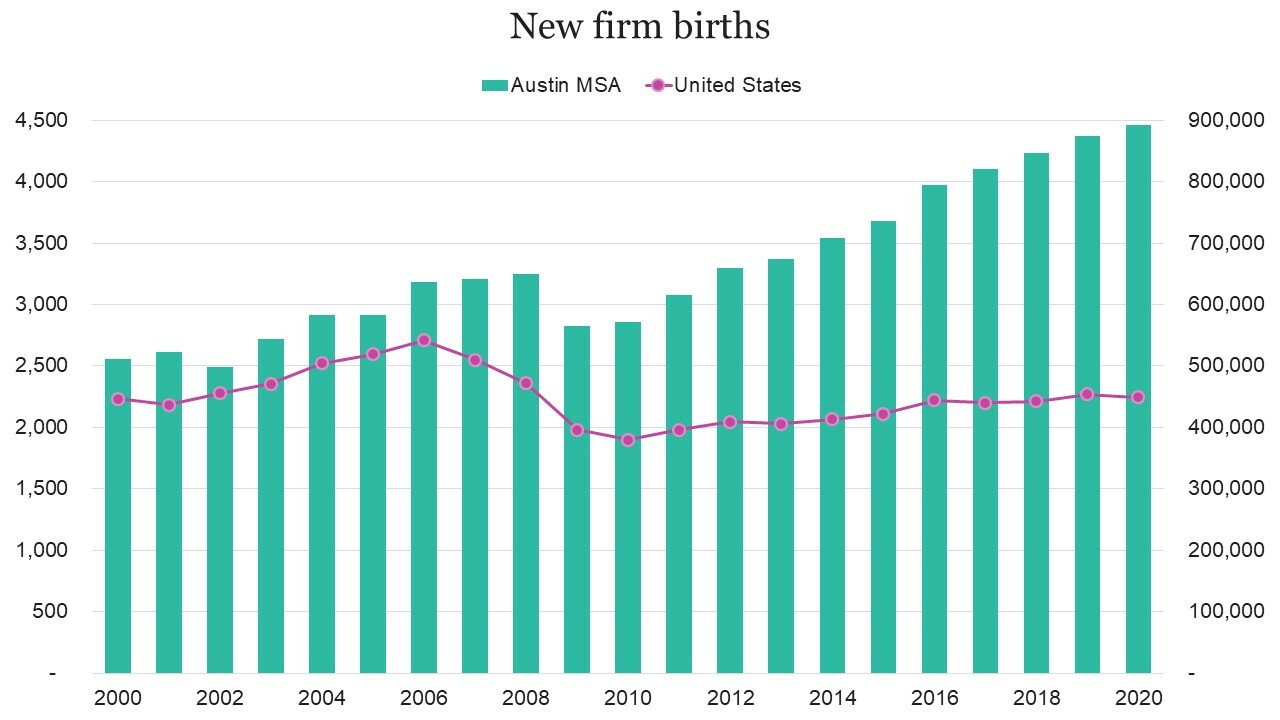
- New businesses formed in the Austin metro reached a new peak of 4,460 in 2020.
- Austin’s startup density, 194 per 100,000 population, is 144% of the national rate, and ranks 5th among the 50 largest metros.
- With jobs at new firms accounting for 2.4% of all jobs in 2020, Austin ranks 4th among major metros for startup job creation.
- While Austin outperforms nearly all metro economies, it is not isolated from the long-term downward trend in the business formation rate seen nationally over the last few decades.
New business formation in Austin climbed to 4,460 in 2020, exceeding 2019 by 2.0%. Nationally, 448,863 new firms formed in 2020, down by 1.1% from 2019.
Austin ranks 21stamong major metropolitan areas for number of new businesses created in 2020, a position higher than where the metro ranks in 2020 based on the size of its population (28th) or its economy (24th).
Among the top 50 metros, only 15 saw an increase in business creation in 2020, down from 37 metros with positive growth in 2019. Growth in 2020 was 0.9% in Dallas-Ft. Worth, while San Antonio and Houston saw fewer new firms in 2020 (-2.2% and -3.0% respectively).
This data comes from the U.S. Census Bureau’s release in September of new data from the Business Dynamics Statistics (BDS) program. The BDS program has become an important tool providing insights about business formation and growth, labor market dynamics, and other features of the economy crucial to understanding current and historical U.S. entrepreneurial activity. BDS is the gold standard of business creation data. It is based on the Census Bureau’s Longitudinal Business Database of the universe of employer companies (not a sample survey) and tracks economic activity at both the firm and establishment level over a long period of time. BDS tracks the annual number of new businesses (startups and new locations), and tracks creation and destruction of jobs at the establishment level by firm age, size, and industry, (based on the first-quarter employment of a given year)[1] providing a picture of the dynamics underlying aggregate net growth in employment.

The number of new U.S. firms created annually has not regained pre-Great Recession levels—2020 is 17% below the peak attained in 2006 (541,605). Austin’s number of new firms grew each of the last 11 years and has exceed Austin’s pre-Great Recession peak (2008) since 2012.
While new businesses formed in the Austin metro reached a new peak at 4,460 in 2020 and that total exceeds the metro’s pre-Great Recession 2008 peak by 37%, current levels in Texas’ other major metros are not as strongly recovered. Dallas-Ft. Worth’s and Houston’s number of new firms created in 2020 exceeds their pre-Great Recession peaks by 15%, while San Antonio is up by 2%.[2]

Although the number of business starts could be said to have recovered in Austin by 2012, on a per capita basis, new firms are not forming at the rate they were before the Great Recession. Austin saw over 200 new businesses per 100,000 population each year from 1978 to 2000.[3] Rates faltered following the 2001 “dot com” recession, which hit Austin harder than much of the rest of the country, and have stayed below 200 since the Great Recession. Austin’s current per capita rate of business formation is 18% above its 2010 low point. Nationally, new businesses formed per 100,000 population in 2020 is 10% above 2010 and Texas is 12% above.
Over the pre-Great Recession decade, the rate of business formation in Austin averaged 121% of the national rate, but has been increasing and, in 2020, Austin’s startup density is 144% of the national rate. Austin has the fifth greatest startup density among the 50 largest metros in 2020 and, based on 2016-2020, Austin ranks sixth.

In the Austin metro in 2020, new establishments created 47,157 jobs and these new establishments included both startups (firms less than 1 year old) and new establishments of existing firms of varying ages. Expansions at existing establishments created another 91,860 jobs.


Startups accounted for 22,592 or 48% of the 47,157 new establishment jobs created in 2020. That rate is below 2019’s 54%, but higher than the average rates over the last five or 10 years (47% and 46% respectively).

The share of employment in new and young firms is also a key startup density measure. New and young firms account for a larger share of job creation than they do of employment and as the graph above illustrates, in Austin, they account for greater shares of both employment and job creation than they do in the nation as a whole.

In 2020, 4,460 startups accounted for 22,592 new jobs, representing 2.4% of all jobs in the metro, down from 2.5% in 2019. This is only the fourth time in the last three decades that Austin has seen this rate fall below 2.5%. Nevertheless, among the 50 largest metros, Austin ranked fourth for the percent of jobs created by startups in 2020. Nationally, startups accounted for 1.8% of all jobs in 2020 and in Texas, the share was 2.2%.

Each perspective on business entry and job creation provided in the BDS dataset is also available for business exits and job destruction. In 2020, 4,933 establishments exited in Austin, representing 9.7% of businesses. This is up from 9.3% in 2019. Nationally, the exit 2020 rate is 9.4%, up from 8.5% in 2019.

Nationally, close to a quarter of new businesses exit within their first year. The current BDS release does not provide the same firm age detail at the metro level that it does at the national level. But it does provide detail for young firms, that is, those 1 to 5 years old. In 2020, 15.8% of establishments of young firms exited in Austin in 2020. Among major metros, the rate ranged from a low of 14.8% in Milwaukee to a high of 21.5% in Orlando. Austin’s rate ranked fourth lowest among the 50 largest metros. Exit rates were higher than Austin in Texas’ other major metros—17.6% in Dallas-Ft. Worth, 18.2% in Houston and 18.5% in San Antonio.

The graph below summarizes jobs created by new businesses and continuing businesses and jobs destroyed by businesses closing and continuing businesses laying off jobs in Austin.

In Austin in 2020, 139,017 jobs were created—47,157 by new businesses and 91,860 by continuing existing businesses. At the same time, 119,617 jobs were destroyed—by businesses closing and 78,434 as layoffs by continuing businesses. The net result is positive net job creation of 19,400 (2.1%) in 2020. In 2019, net job creation was 24,638 and the net job creation rate was 2.7%.


Recently added to BDS data are statistics by industry sector at the metro level.
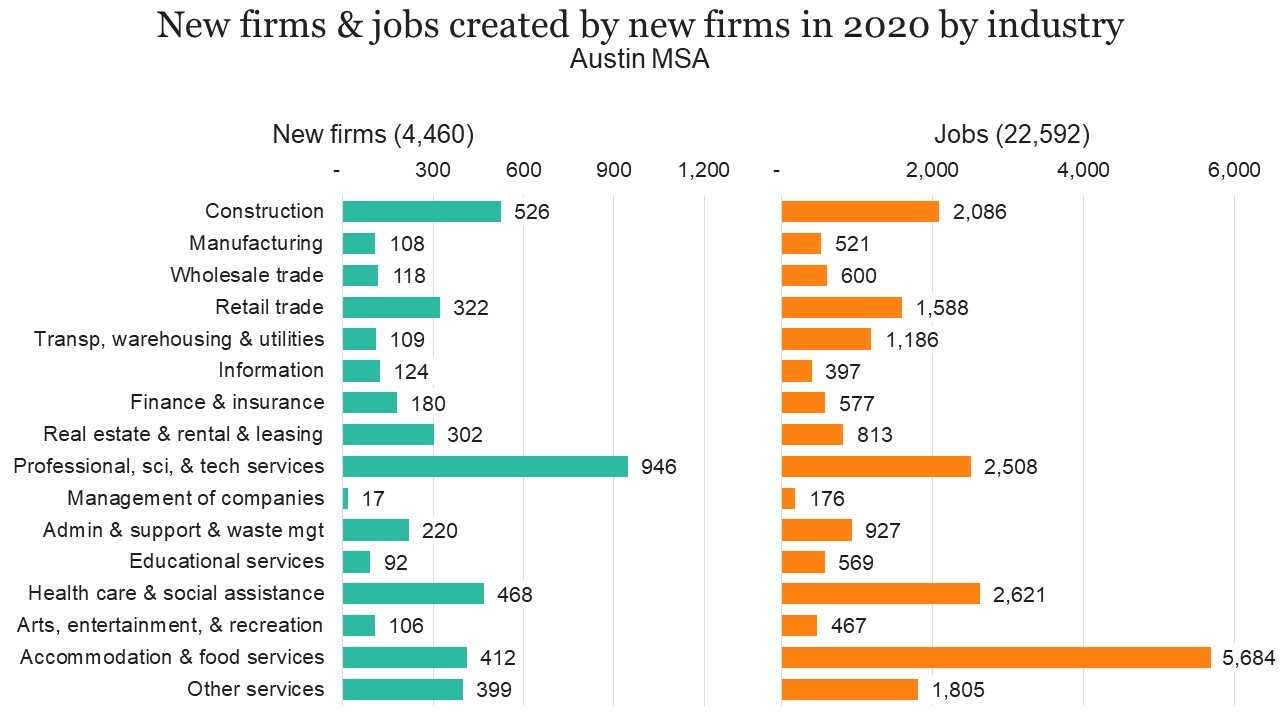
In Austin in 2020, the professional, scientific and technical services industry saw more establishment births (1,246) and exits (976) than any other industry. However, the accommodation and food services industry is responsible for the largest numbers of both jobs created (18,808) and eliminated (16,676).

On a net basis, the retail trade industry had a larger impact than any other in 2020 in Austin. Retail trade businesses created 13,404 jobs and eliminated 8,699 jobs, thus adding 4,705 net new jobs. The largest negative impact was the net loss of 2,330 jobs in administrative and support and waste management and remediation services (14,776 jobs eliminated exceeding 12,446 jobs created). Management of companies had largest rate of net new job creation in 2020 in Austin (9.6%) and mining had the highest negative rate (10.0%).[4] The overall rate of net job creation was 2.1%.

Excluding the small natural resources and mining sectors, Austin businesses in the arts, entertainment, and recreation industry were most likely to go out of business in 2020. The establishment exit rate was 14.0% in 2020, up from 10.2% in 2019. Nationally, the 2020 establishment exit rate for the industry was 11.5%.
Industry detail is also available in the tabulations by firm age, so we can also look at numbers of startups and their job creation. The “Establishment births & exits in 2020 by industry” graph above shows 1,246 new establishments in the professional, scientific and technical services industry. The second graph entitled “Jobs created/lost in 2020 by industry” shows those new establishments creating 5,032 jobs, with the remaining 13,024 jobs being created by expansions of existing establishments. The graph below shows that 946 of the 1,246 new establishments are new firms, i.e., startups (not new establishments of existing firms). Those 946 startups in the professional, scientific and business services industry created 2,508 jobs.
We can also compare job creation and loss by type of establishment for an industry from year to year.


The following four graphs illustrate shares of employment and job creation/destruction by firm employment size and also disaggregate job creation by firm employment size for new and for expanding establishments.


For additional information on the evolution of job growth and employment at U.S. firms over the last 40 years with respect to firm age, size, and industry, there are two recent Census Bureau publications:
Business Dynamics Statistics Trace Evolution of Job Growth, Employment at U.S. Firms Over Four Decades, Feb. 2022
The Business Dynamics Statistics: Describing the Evolution of the U.S. Economy from 1978-2019, Oct. 2021
FOOTNOTES:
- The employment measure used is the number of employees at the establishment in the payroll period including March 12. As firm size and firm age measures are also employment based, this March basis would seem to indicate that 2020 numbers from the BDS are not reflecting impacts of COVID-19. ↩
- That is, peaks reached in the decade immediately preceding the last recession and excluding peaks of the 1980s. ↩
- During the 1980s, Austin saw an average of 305 new firms per 100,000 population created each year. In the 1990s, the average was 234. ↩
- Because of relative size of the industry in Austin (2,344 jobs in 2020) and for the sake of simplification of the graphs, mining was not included in the industry graphs. ↩
Related Categories: Central Texas Economy in Perspective