Housing market
Posted on 11/05/2019 by Beverly Kerr
- Over 28,000 homes sold in the Austin metropolitan area for the first 9 months of 2019, 4.4% more than the same period in 2018.
- In September, Austin inventories were at 2.5 months. With a single exception, Austin had 3.0 or fewer months of inventory on the market every month since November 2012.
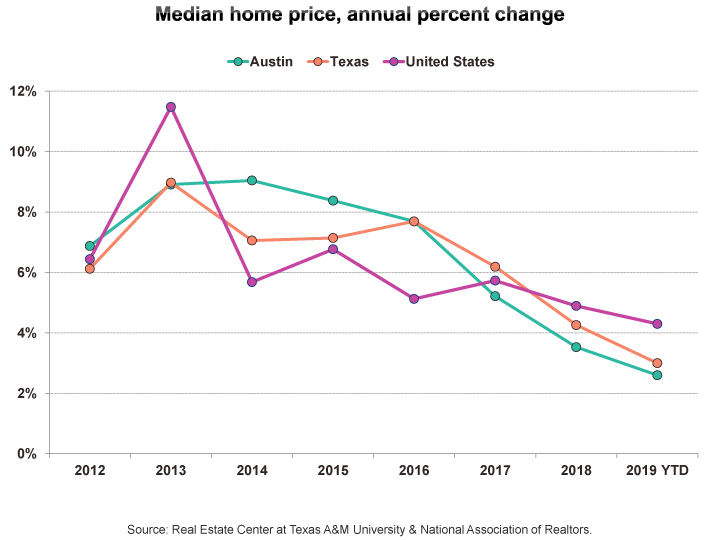
- Austin’s average home price in 2019, $393,248, is up 2.8% compared to the first 9 months of 2018, while the median home price, $314,993, is up 2.6%. The rate of annual price appreciation in Austin has been steadily declining since 2014.
Activity & inventory
Austin’s new and existing home sales in September totaled 2,933, 12.5% above the number of homes sold in September 2018, and -17.0% below the total for the prior month, according to the latest numbers from the Austin Board of Realtors and the Real Estate Center at Texas A&M. That August to September drop is consistent with the seasonal pattern in the Austin market.

On a year-to-date basis, the 28,067 homes sold in the Austin metropolitan area in the first nine months of 2019 is 4.4% greater than the number sold over the same period last year. Single-family homes, which account for 90% of Austin sales thus far in 2019, are up 5.7% over the same period last year.

National Association of Realtors data for the U.S. show September existing home sales up 7.4% over the volume one year ago, while year-to-date sales are down 1.7%. Statewide, September sales are up 8.6% compared to a year ago, and 2019 year-to-date sales are up 2.6% over the first nine months of 2018.
The dollar volume of Austin metro 2019 home sales through September is 7.4% ahead of the same period last year, while the gains are less statewide (5.5%) and nationally (1.4%). For the month of September, the value of Austin sales are up 20.1% over last September, while Texas is up 12.5% and the nation is up 11.9%.

Austin’s months of inventory on the market measure has averaged 2.5 months in 2019 to date, the same as the first nine months of last year. In September, inventories are at 2.5 months. The last time inventories registered as high as 3.0 months was in September of last year. With a single exception, Austin has had three or fewer months of inventory on the market every month since November 2012. Statewide, supply has averaged 3.7 months in 2019 compared to 3.5 over the first nine months of 2018. At 3.8 months in September 2019, statewide supply is down from 3.9 in August and up slightly from 3.7 one year ago. Nationally, the months of inventory increased from an average of 4.0 in 2018 to 4.1 in 2019 on a year-to-date basis, and in September 2019, supply is at 4.1 months, up from 4.0 last month but down from 4.4 months a year ago.
A balanced supply of inventory is commonly considered to be six months. Only homes priced over $750,000 (13.5% of September’s listings) approach a balanced supply in Austin (4.1 months for $750,000-$1,000,000 homes and 7.0 months for $1,000,000+ homes). The months of inventory calculation is derived from the number of homes sold and the number of active listings.

September 2019’s active listings (7,536) are 11.4% below one year ago. However, 2019’s monthly average of 7,233 listings on the market is down only 1.0% from the first nine months of 2018. Average monthly listings in 2018 (7,327) were higher than any year since 2011.
Prices
Austin’s median home price in September is $320,000, essentially unchanged from August (up by 0.02%), but up from one year ago by $22,000 or 7.4%. Statewide, September’s median sales price is $242,000, up $12,000 or 5.2% from a year ago. The national median price is $272,100, up $15,200 or 5.9% from September 2018.

Austin’s year-to-date median sales price is $314,993, up 2.6% over the same period of 2018, while the state is at $240,000 and up 3.0%. Austin’s rate of annual price appreciation has been steadily declining since 2014.
The median sales price in the Dallas metro for September is $289,400, up 3.4% from last September; Fort Worth’s median is $243,375, up 5.8%; and San Antonio was at $232,500, or 5.7% higher than one year ago. September data for Houston does not become available until later this month. In August, Houston’s median price was $249,000, up 5.5% from August 2018.

In 2014, Austin’s median price of homes sold exceeded the state median by over 30% for the first time. The differential between Austin and the state approached this level just before the dot-com recession. After falling each year through 2005 (reaching 18%), the difference climbed sharply through 2008 and for 2008-2013 averaged about 29%. In 2015 and 2016, Austin’s median price was more than 33% higher than the state’s median. However, since then, the differential has been narrowing and sits below 31% for year-to-date 2019. Austin’s median price relative to the national median price has moved similarly. Austin’s home price was 20% higher than the national median in 2016, but in 2019, the differential has fallen to 16%.

The average price in Austin in September, at $397,190, is up 1.0% from August and up 6.7% from a year ago. On a year-to-date basis, Austin’s 2019 average sales price is $393,248, up $10,832 or 2.8% from 2018. For Texas, the average price thus far in 2019 is $291,615, up 2.8% from 2018. The YTD national average price for 2019 is $308,507, 3.2% over 2018.
The Real Estate Center at Texas A&M publishes market data for ten local market areas within the Austin metropolitan area. Median sales prices for September 2019 ranged from $385,000 in Austin to $223,000 in Kyle. The local market price trends are represented on the two graphs below.


The National Association of Realtors (NAR) produces a quarterly release of price data for existing single-family homes for about 180 U.S. metros. The following table indicates where Austin and the other major Texas metros stack up relative to the fastest appreciating markets among the 50 largest metros.[1] Austin is the 18th most expensive major metro in the latest quarter and the last calendar year. Austin ranked 33rd for price appreciation between 2016 and 2018 and 21st between 2018 Q2 and 2019 Q2). [NAR’s third quarter data does not arrive until later this week.]

The following three graphs illustrate the distribution of home sales by price range over the last several years and the current number of active listings by county and price range.


The Chamber’s Economic Indicators page includes an Excel spreadsheet (updated monthly) of Austin, Texas, and national time series data for home sales and prices from the Real Estate Center at Texas A&M and the National Association of Realtors, as well as Housing Opportunity Index data from the National Association of Home Builders.
FOOTNOTE:
- Two large metros, Detroit and Pittsburgh, are not currently reported in the NAR release. ↩
Related Categories: Central Texas Economy in Perspective