Business Dynamics Statistics – firm startups & related measures
Posted on 05/11/2021 by Beverly Kerr
Sign up for the Central Texas Economy Report newsletter
- New businesses formed in the Austin metro reached a new peak of 4,170 in 2018.
- Austin’s startup density, 193 per 100,000 population, is 146% of the national rate, and ranks 4th among the 50 largest metros.
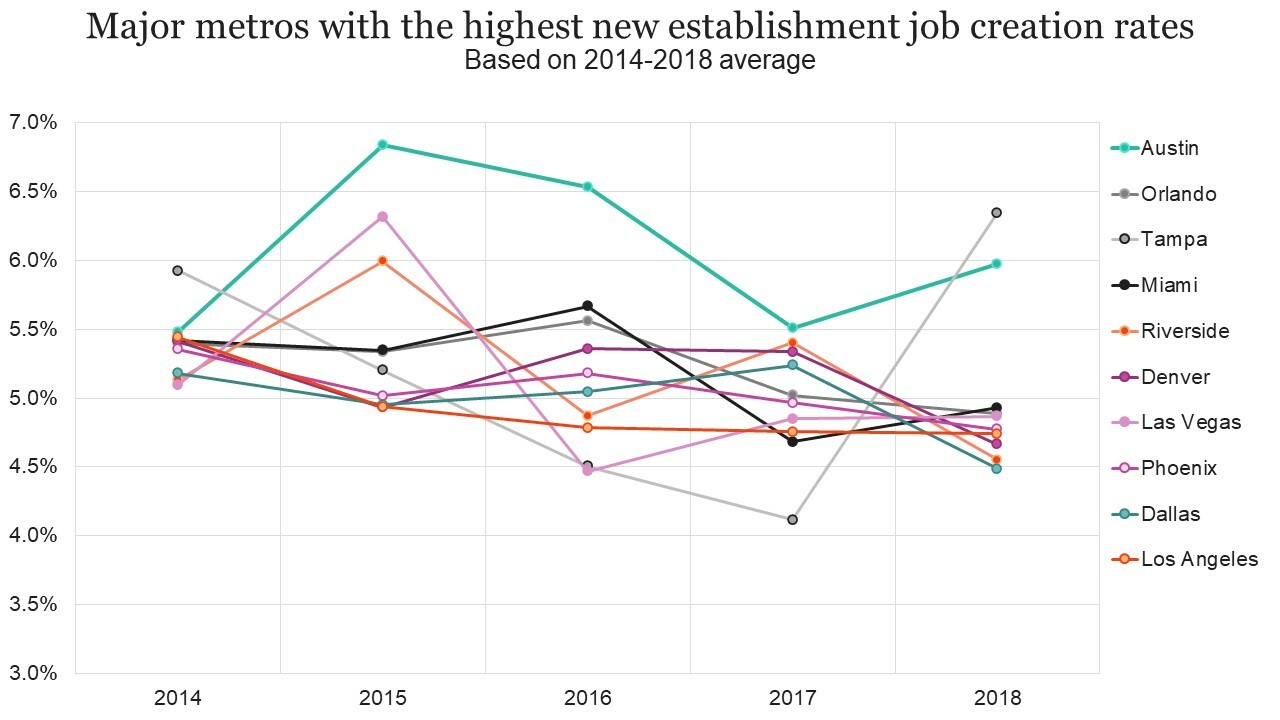
- With jobs at new firms accounting for 2.7% of all jobs in 2018, Austin ranks 3rd among major metros for startup job creation.
- While Austin outperforms nearly all metro economies, it is not isolated from the long-term downward trend in the business formation rate seen nationally over the last few decades.
New business formation in Austin climbed to 4,170 in 2018, exceeding 2017 by 2.5%. Nationally, 430,630 new firms formed in 2018, almost unchanged from 2017.
Austin ranks 22nd among major metropolitan areas for number of new businesses created in 2018, a position higher than where the metro ranks in 2018 based on the size of its population (30th) or its economy (26th).
Among the top 50 metros, 25 saw an increase in business creation in 2018, up from 23 metros with positive growth in 2017. Growth in 2018 was 1.7% in Dallas-Ft. Worth and 1.0% in San Antonio, while Houston saw fewer new firms in 2018 (-0.7%).

This data comes from the U.S. Census Bureau’s release in March of new data from the Business Dynamics Statistics (BDS) program. The BDS program has become an important tool providing insights about business formation and growth, labor market dynamics, and other features of the economy crucial to understanding current and historical U.S. entrepreneurial activity. BDS is the gold standard of business creation data. It is based on the Census Bureau’s Longitudinal Business Database of the universe of employer companies (not a sample survey) and tracks economic activity at both the firm and establishment level over a long period of time. BDS tracks the annual number of new businesses (startups and new locations), and tracks creation and destruction of jobs at the establishment level by firm age, size, and industry, providing a picture of the dynamics underlying aggregate net growth in employment.

The number of new U.S. firms created annually has not regained pre-Great Recession levels—2018 is 24.0% below the peak attained in 2006 (566,888). Austin’s number of new firms grew each of the last nine years and has exceed Austin’s pre-Great Recession peak (2006) since 2013.
While new businesses formed in the Austin metro reached a new peak at 4,170 in 2018 and that total exceeds the metro’s pre-Great Recession 2006 peak by 24.9%, current levels in Texas’ other major metros are not similarly recovered.[1] Dallas-Ft. Worth’s and Houston’s number of new firms created in 2018 exceeds 2006 by 3.9% and 2.3%, respectively, while San Antonio’s falls short of its 2006 pre-Great Recession peak by 6.3%.

Although the number of business starts could be said to have recovered in Austin by 2013, on a per capita basis, new firms are not yet forming at the rate they were before the Great Recession. Austin saw over 200 new businesses per 100,000 population each year from 1978 to 2000.[2] Rates faltered following the 2001 “dot com” recession, which hit Austin harder than much of the rest of the country, and have stayed below 200 since the Great Recession. Austin’s current rate of business formation is 18.1% above its 2010 low point. Nationally, new businesses formed per 100,000 population in 2018 is 9.3% above 2010 and Texas is 11.5% above.
Over the pre-recession decade, the rate of business formation in Austin averaged 122% of the national rate, but has been steadily increasing and, in 2018, Austin’s startup density is 146% of the national rate. Austin has the third greatest startup density among the 50 largest metros in 2018 and, based on 2014-2018, Austin ranks fifth.

In the Austin metro in 2018, new establishments created 51,518 jobs and these new establishments included both startups (firms less than 1 year old) and new establishments of existing firms of varying ages. Expansions at existing establishments created another 82,045 jobs.

Startups accounted for 23,755 or 46% of the 51,518 new establishment jobs created in 2018. That rate is higher than the preceding three years. The average over the last five years, and over the last 10 years, was 44%. However, rate fluctuates fairly widely from year to year, ranging from 36% to 51% over the last five years.

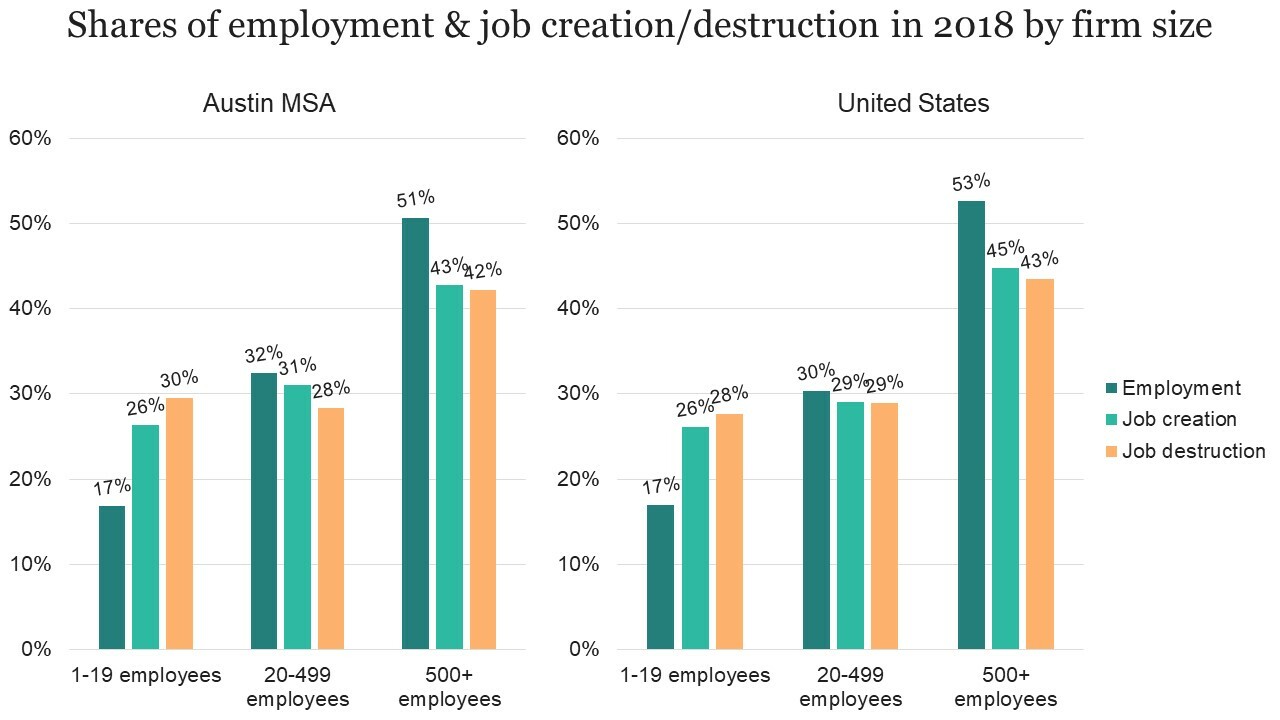
The share of employment in new and young firms is also a key startup density measure. New and young firms account for a larger share of job creation than they do of employment and as the graph above illustrates, in Austin, they account for greater shares of both employment and job creation than they do in the nation as a whole.

In 2018, 4,170 startups accounted for 23,755 new jobs, representing 2.7% of all jobs in the metro, up from 2.5% in 2017. Among the 50 largest metros, Austin ranked third behind Minneapolis and Los Angeles for the percent of jobs created by startups in 2018. Nationally, startups accounted for 1.9% of all jobs in 2018 and in Texas, the share was 2.2%.

Each perspective on business entry and job creation provided in the BDS dataset is also available for business exits and job destruction. In 2018, 4,341 establishments exited in Austin, representing 9.1% of businesses. This is the third lowest exit rate since the beginning of BDS data in 1978. Nationally, the exit rate is even lower, 8.5%, and that rate is the second lowest since 1978.

Nationally, close to a quarter of new businesses exit within their first year. The current BDS release does not provide the same firm age detail at the metro level that it does at the national level. But it does provide detail for young firms, that is, those 1 to 5 years old. In 2018, 15.6% establishments of young firms exited in Austin in 2018. Among major metros, the rate ranged from a low of 13.8% in Cincinnati to a high of 19.5% in Miami. Austin’s rate ranked 19th among the 50 largest metros. The exit rates were higher in Texas’ other major metros—16.7% in Dallas-Ft. Worth and Houston and 17.2% in San Antonio.

The graph below summarizes jobs created by new businesses and continuing businesses and jobs destroyed by businesses closing and continuing businesses laying off jobs in Austin.

In Austin in 2018, 133,563 jobs were created—51,518 by new businesses and 82,045 by continuing existing businesses. At the same time, 95,505 jobs were destroyed—30,488 by businesses closing and 65,017 as layoffs by continuing businesses. The net result is positive net job creation of 38,058 in 2018.


New to this release of BDS data are statistics by industry sector at the metro level. In Austin in 2018, the professional, scientific and technical services industry saw more establishment births (1,087) and exits (950) than any other industry.
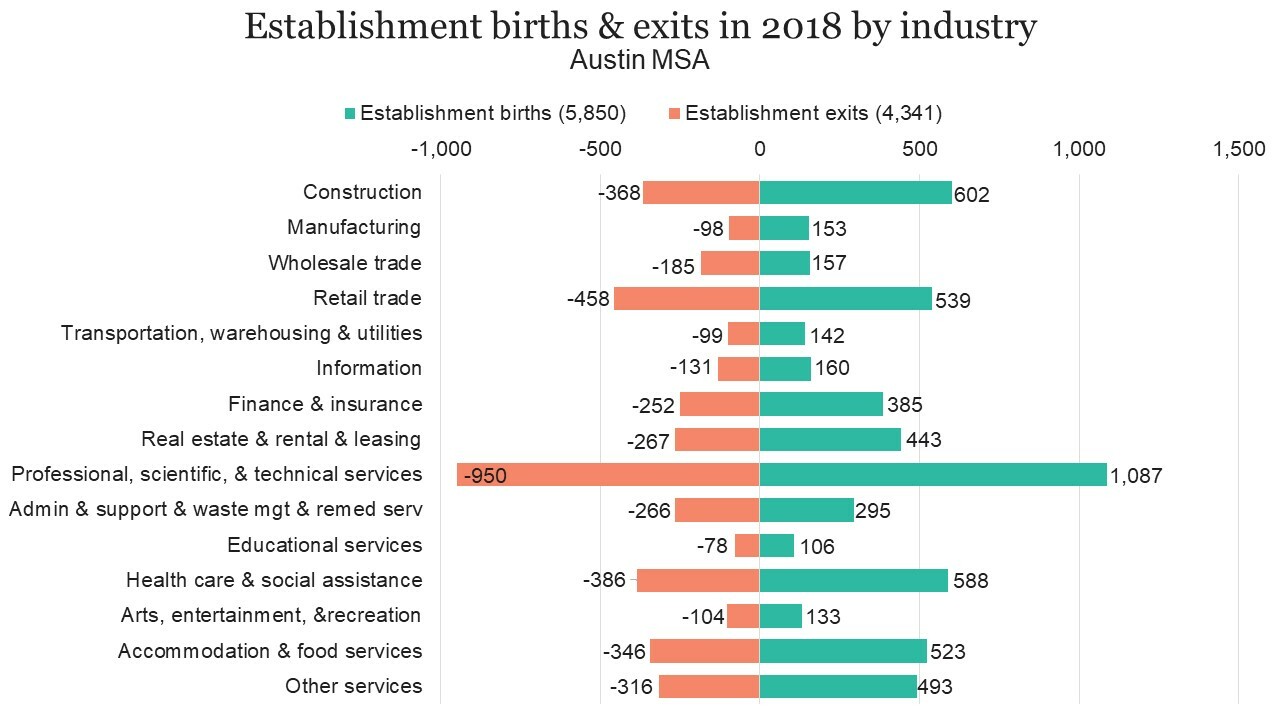
However, the accommodation and food services industry is responsible for the largest numbers of both jobs created (19,614) and eliminated (14,528). On a net basis, the information industry had a larger impact than any other in 2018 in Austin. Information businesses created 11,389 jobs and eliminated 4,893 jobs, thus adding 6,496 net new jobs. Information had the second largest rate of net new job creation in 2018 in Austin (15.5%) after mining (20.4%).[3] The average rate of net job creation was 4.4%.

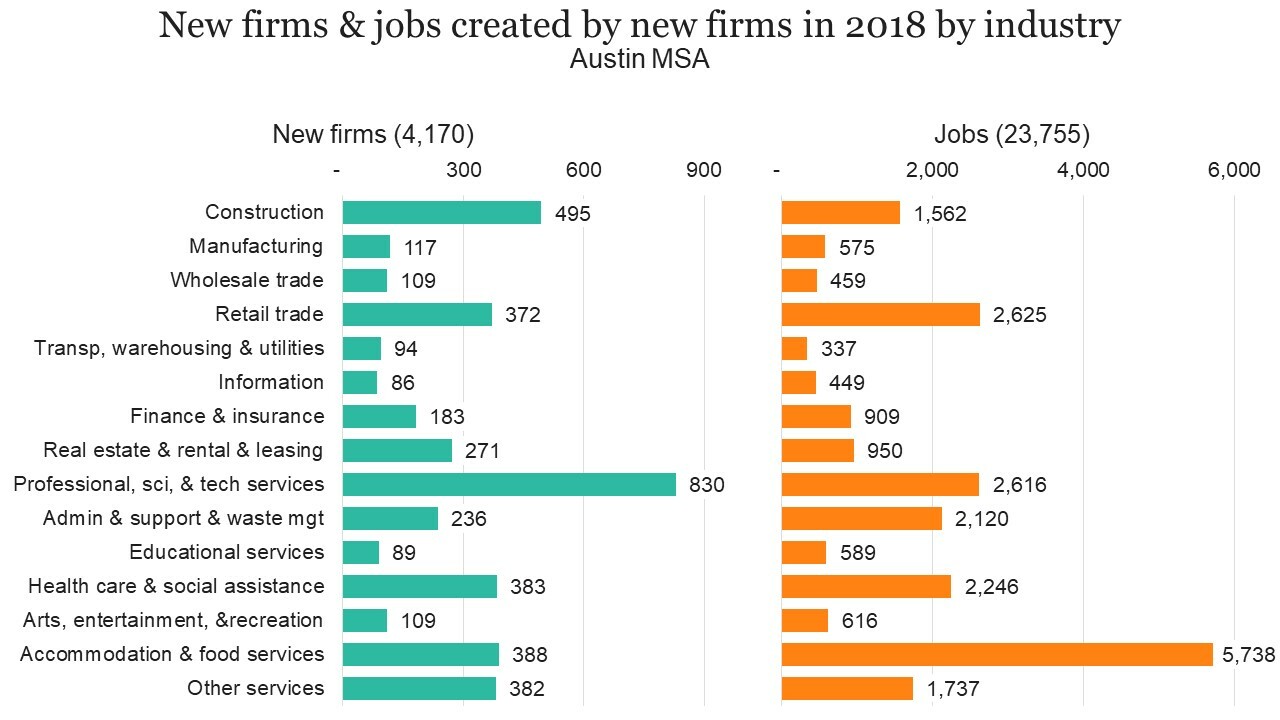
Industry detail is also available in the tabulations by firm age, so we can also look at numbers of startups and their job creation. The “Establishment births & exits in 2018 by industry” graph above shows 1,087 new establishments in the professional, scientific and technical services industry. The second graph entitled “Jobs created/lost in 2018 by industry” shows those new establishments creating 5,054 jobs, with the remaining 11,159 jobs being created by expansions of existing establishments. The graph below shows that 830 of the 1,087 new establishments are new firms, i.e., startups (not new establishments of existing firms). Those 830 startups in the professional, scientific and business services industry created 2,616 jobs.
We can also compare job creation and loss by type of establishment for an industry from year to year.
The following four graphs illustrate shares of employment and job creation/destruction by firm employment size and also disaggregate job creation by firm employment size for new and for expanding establishments.


FOOTNOTES:
- That is, peaks reached in the decade immediately preceding the last recession and excluding peaks of the 1980s. ↩
- During the 1980s, Austin saw an average of nearly 300 new firms per 100,000 population created each year. In the 1990s, the average was 235. ↩
- Because of relative size of the industry in Austin and for the sake of simplification of the graphs, mining was not included in the industry graphs. ↩