Personal Income
Posted on 12/06/2016 by Beverly Kerr
- Austin’s total personal income grew by 7.2% in 2015, the 4th fastest growth rate among major metros.
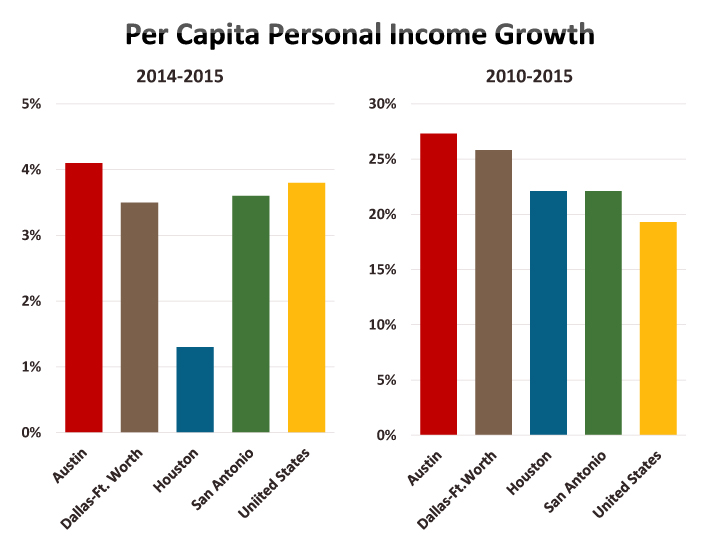
- Over the last five years, per capita income growth was 27.3% in Austin, compared to 19.3% for all metros.
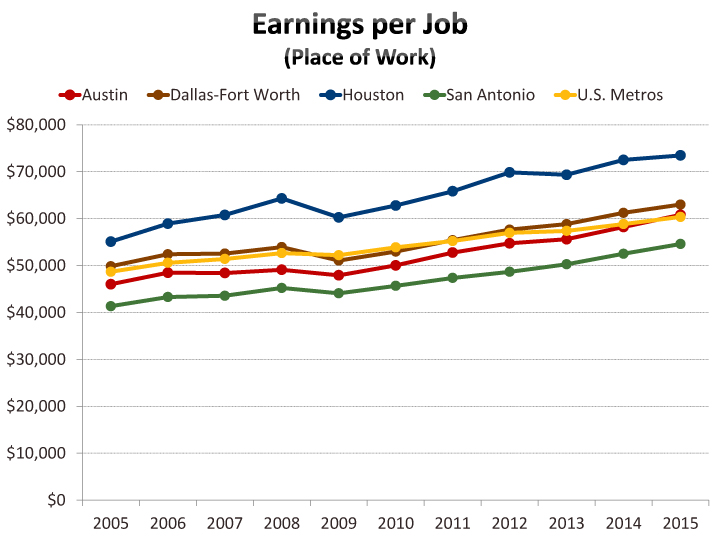
- Austin is the 3rd best performing major metro based on growth in earnings per job over the last year and the past five years.
Personal income totaled $102.1 billion in the five-county Austin metropolitan area in 2015 according to the latest annual release by the U.S. Bureau of Economic Analysis (BEA) of personal income data for metropolitan areas and counties. Austin’s total personal income rose 7.2% in 2015. Personal income is the broadest measure of local economic activity available,[1] with the exception of gross domestic product by metro.

All but ten of the nation's 382 metropolitan areas saw personal income growth in 2015. In aggregate, growth was 4.7% for the metropolitan portion of the U.S. Growth ranged from -8.9% in Midland, TX to 9.3% in Bend, OR.

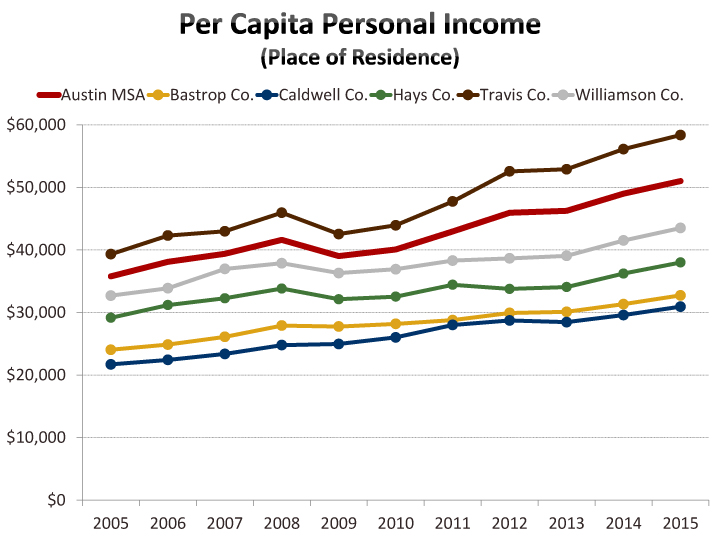
Austin’s 7.2% growth in personal income from 2014 to 2015, was the 4th fastest rate of growth among the 50 largest metros. Nashville’s 8.6% growth was the highest among large metros. Within the Austin metro, growth ranged from 6.3% in Travis County to 10.3% in Hays County.
Austin's personal income growth over the last five years is 47.4%, better than any of the 50 largest metros and nearly double the 24.9% growth for metropolitan portion of the U.S.
Austin's robust population growth and job growth—among large metros, Austin is No. 1 for growth in both measures over the last five years—would be expected to drive relatively strong aggregate personal income and earnings growth. Therefore, growth in per capita income and in earnings per job would be the measures to look to for an indication of improvements in Austin’s standard of living relative to other major metros.

In the past, Austin has fallen short of the top ranks for growth in per capita personal income and in earnings per job. For example, between 2000 and 2010, Austin saw 21.8% growth in per capita personal income, while growth was 30.0% for the metropolitan portion of the U.S. Between 2005 and 2010, Austin improved—growth was 12.0% compared to 11.3% across all metros.

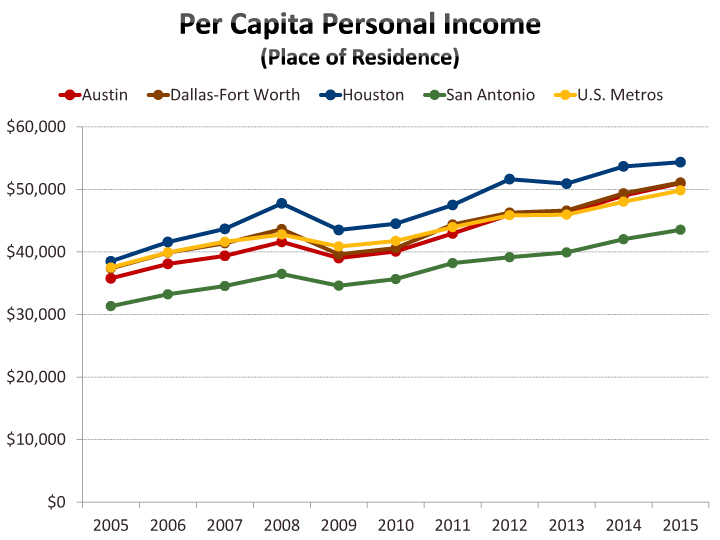
With the release of data through 2015, Austin has turned in decisively better per capita personal income growth than U.S. metropolitan areas as a whole. Over the last five years, per capita income growth was 27.3% in Austin, compared to 19.3% for all metros. Among major metros, Austin ranks as the 4th best performing over 2010-2015. Over the last two years, Austin’s per capita personal income growth is 10.3% growth compared to 8.4% for all metros and Austin ranks 6th among large metros. Over the last year, per capita personal income grew 4.1% compared to 3.8% for all metros and Austin ranked 20th among large metros.
In 2015, per capita personal income is $51,014 in Austin, 2.4% above the average for the metropolitan portion of the U.S. Austin’s per capita personal income has exceeded the metro average for the last four years. The only previous period in which Austin had higher per capita income than the metro average was from 1998 to 2002. Among the top 50 metros, Austin ranks 17th for per capita personal income.

Other measures produced by the BEA’s personal income estimates include average earnings per job, a measure comprising earnings of both wage and salary workers and proprietors[2]; average compensation per job, a measure of total compensation to wage and salary workers (i.e., wages and salaries, plus employer contributions for pensions, insurance funds, and government social insurance programs); and average wages and salaries per job.


Relative to other metropolitan areas, Austin has seen strong gains in average earnings per job. At $60,805 in 2015, earnings per job is up 4.4% over 2014, with only San Jose and Nashville gaining better. Over the last two years, growth is 9.3%, and again Austin is the 3rd best performing major metro. Over the last five years, Austin’s earnings per job is up 21.5%, compared to only 12.0% for the metropolitan portion of the U.S. and, again, only two metros (San Jose and Denver) perform better over the period.


In Austin, average compensation per job of wage and salary workers in 2015 is $67,568—very close to the $67,757 average for all U.S. metros. On this measure, Austin’s growth also tops that of most major metros. Austin ranks 6th for growth over the last year (4.0%), 2nd for growth over the last two years (7.6%), and 5th for growth over the last five years (15.3%).

Austin’s superior performance continues with average wage and salary growth per job. At $56,417 in Austin in 2015 (compared to $55,102 for all metros), Austin ranks 8th for growth over the last year (4.1%), 3rd for growth over the last two years (7.9%), and 7th for growth over the last five years (16.0%).
In 2015, average earnings per job and wages and salaries per job exceed the metropolitan average for these measures for the first time since the early 2000s (since 2003 for the former and since 2000 for the latter). Compensation per job in Austin in 2015 is slightly below the average for all metros, but the difference has narrowed to 0.3%.
Note that this data is not adjusted for inflation and that inflation, as measured by the national price index for personal consumption expenditures, declined to 0.3% in 2015, from 1.5% in 2014, and inflation has averaged 1.5% annually over the last five years. Later this year, the BEA will release real personal income data through 2015. That release will also include adjustments for the differences in price levels across geographic areas. [See our article here about the last release of real personal income.]
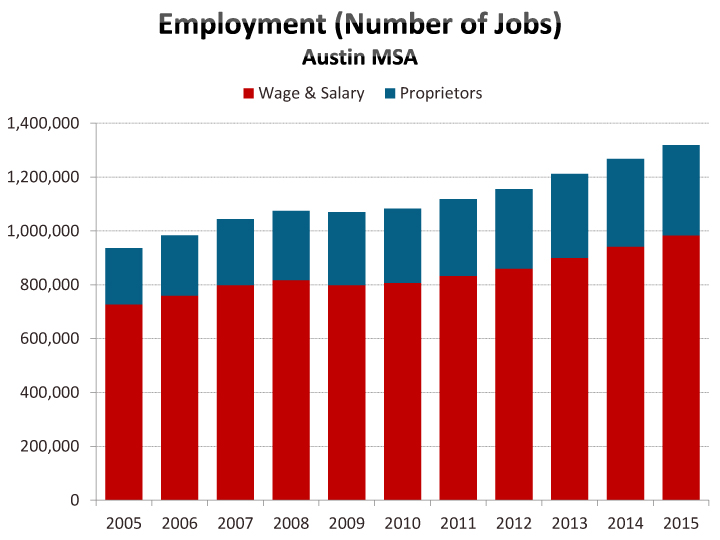
The employment data in the BEA's personal income tables includes subtotals for wage and salary workers and proprietors. In 2015, Austin's full and part-time jobs totaled 1,318,500, with 983,366 being wage and salary jobs, and 335,134 representing proprietors. Proprietors account for 25.4% of total jobs in 2015 in Austin, up from 22.4% ten years ago. For all U.S. metros, proprietors represent 21.8% of jobs, up from 18.3% ten years ago.
All of the Local Area Personal Income and Employment data for metros and counties on the BEA's website begins in 1969. If you'd like to delve into this data, click here. Easy to create and export maps are also available.

Many additional series related to the derivation of personal income are available that have not been treated above. In addition, a wealth of industry detail for personal income, earnings, compensation, and employment is also available. Local area personal income definitions and methodologies are located here.


FOOTNOTES:
[1] Personal income is the income received by, or on behalf of, all persons from all sources: from participation as laborers in production, from owning a home or unincorporated business, from the ownership of financial assets, and from government and business in the form of transfer receipts. It includes income from domestic sources as well as from the rest of the world. Personal income is the income that is available to persons for consumption expenditures, taxes, interest payments, transfer payments to governments and the rest of the world, or for saving.
[2] Proprietors’ employment consists of the number of sole proprietorships and the number of general partners. Proprietors’ income is the current-production income of sole proprietorships and partnerships and of tax-exempt cooperatives.
Related Categories: Central Texas Economy in Perspective