Housing Market
Posted on 11/07/2017 by Beverly Kerr
- The number of homes sold in the Austin metropolitan area for the first nine months of 2017 was 26,250, 3.1% more than the same period in 2016.
- In September, inventories were at 3.0 months. Until this June, Austin had less than three months inventory on the market every month since November 2012.
- Austin's year-to-date dollar volume of sales is 10.0% higher than last year, and the average home price, $365,576, is up 6.7% compared to the first 9 months of 2016.
- The median home price for homes sold in Austin in the first 9 months of 2017 is $295,000, 5.5% above the median price for the same period last year.
Activity & Inventory
Austin’s new and existing home sales in September totaled 2,742, 2.8% above the number of homes sold in September 2016, and -17.7% below the total for the prior month, according to the latest numbers from the Austin Board of Realtors and the Real Estate Center at Texas A&M. That August to September drop is consistent with the seasonal pattern in the Austin market. On a year-to-date basis, the 26,250 homes sold in the Austin metropolitan area in the first nine months of 2017 is 3.1% greater than the number sold over the same period last year.

National Association of Realtors data for the U.S. show September existing home sales down 4.3% over the volume one year ago, while year-to-date sales are up 1.3%. Statewide, September sales are up 0.1% compared to a year ago, and 2017 year-to-date sales are up 3.3% over the first 9 months of 2016.

The dollar volume of Austin metro 2017 home sales through September is 10.0% ahead of the same period last year, while the gain is slightly less statewide (7.0%) and nationally (6.7%). For the month of September, the value of Austin sales are up 1.5% over last September, while Texas is up 5.0% and the nation is down 1.0%.
Austin’s months of inventory on the market measure has averaged 2.7 months in 2017 to date, up from 2.4 in 2016. In September, inventories are at 3.0 months, and this is the fourth month in a row that inventories have been at or above 3 months. Until June, Austin had less than three months inventory on the market every month since November 2012. Statewide, supply has averaged 3.8 months in 2017 compared to 3.7 over the first 9 months of 2016. At 4.0 months in September 2017, statewide supply is down from 4.1 in August and up slightly from 3.8 one year ago. Nationally, the months of inventory fell from an average of 4.5 in 2016 to 4.0 in 2017 on a year-to-date basis, and in September 2017, supply is at 4.2 months, unchanged from last month and below 4.5 months a year ago.
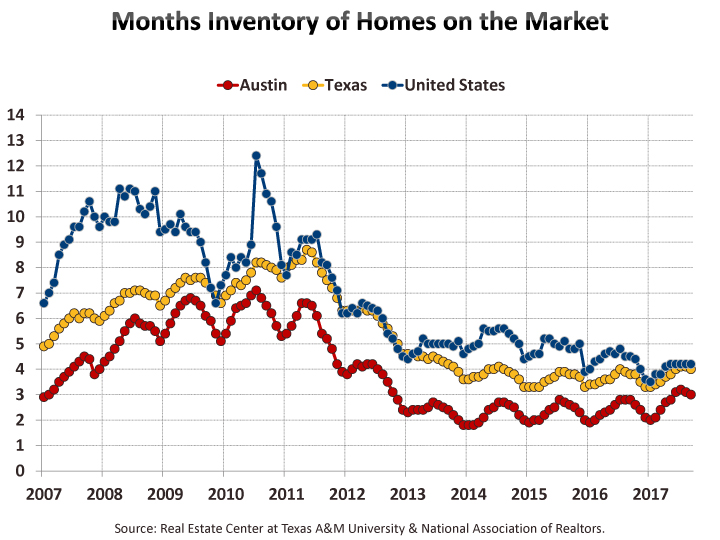
A balanced supply of inventory is commonly considered to be six months. The months of inventory calculation is derived from the number of homes sold and the number of active listings.
There has been a monthly average of 7,561 listings on the market in 2017, up 15.8% from the first 9 months of 2016. The previous four years saw fewer average monthly listings than any year from 2001 through 2012, even though sales steadily climbed each year. September 2017’s active listings (8,498) are 12.1% above one year ago.
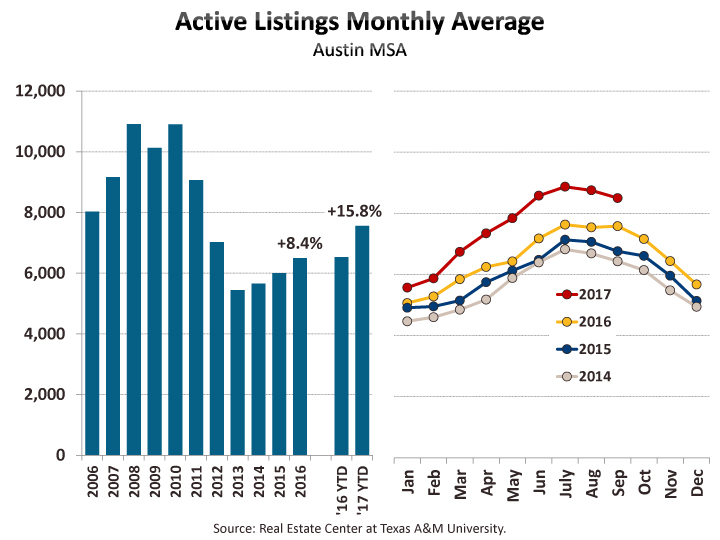
The recent uptick in the number of months on inventory and the number of active listings is not unexpected given the pace of housing starts during 2017. Metrostudy reports that through Q3, annual starts are up 19.1% year-over-year. Lot deliveries hit a new record in Q3 as well. Although builders are starting more homes in Austin than they have in a decade, Metrostudy notes that Hurricane Harvey will likely exacerbate existing construction labor shortages and elevate labor and materials costs.
Prices
Austin’s median home price in September is $289,000, down from August by -1.8%, but up from one year ago by $19,000 or 7.0%. Statewide, September’s median sales price is $223,566, up $13,666 or 6.5% from a year ago. The national median price is $245,210, up $9,900 or 4.2% from September 2016.
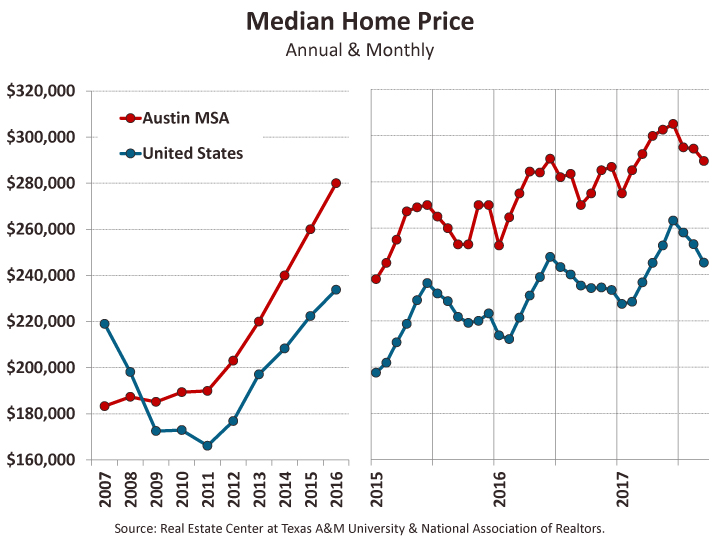
Austin’s year-to-date median sales price is $295,000, up 5.5% over the same period of 2016, while the state is at $224,000 and up 7.0%.
The median sales price in the Dallas metro for September is $270,586, up 8.2% from last September, Fort Worth’s median is $215,000, up 9.7%, and San Antonio was at $212,900, or 6.6% higher than one year ago. September data for Houston does not become available until November 9th. In August, Houston’s median price was $231,900, up 3.1% from August 2016.

In 2014, Austin’s median price of homes sold exceeded the state median by over 30% for the first time. The differential between Austin and the state approached this level just before the dot-com recession. After falling each year through 2005 (reaching 18%), the difference climbed sharply through 2008 and for 2008-2014 averaged about 29%. In 2015 and 2016, Austin’s median price was over 33% higher than the state, however, based on year-to-date numbers, the differential is less than 32% in 2017.
The average price in Austin in September, at $354,722 is down 3.5% from August and up 4.4% from a year ago. On a year-to-date basis, Austin’s 2017 average sales price is $365,576, up $22,881 or 6.7% from 2016. For Texas, the average price thus far in 2017 is $273,161, up 6.3% from 2016. The YTD national average price for 2017 is $287,033, 4.8% over 2016.
Within the Austin MSA, the Real Estate Center at Texas A&M publishes market data for ten local market areas in the region. Median sales prices for September 2017 ranged from $336,733 in Austin to $208,333 in Kyle. The markets are represented on the two graphs below.


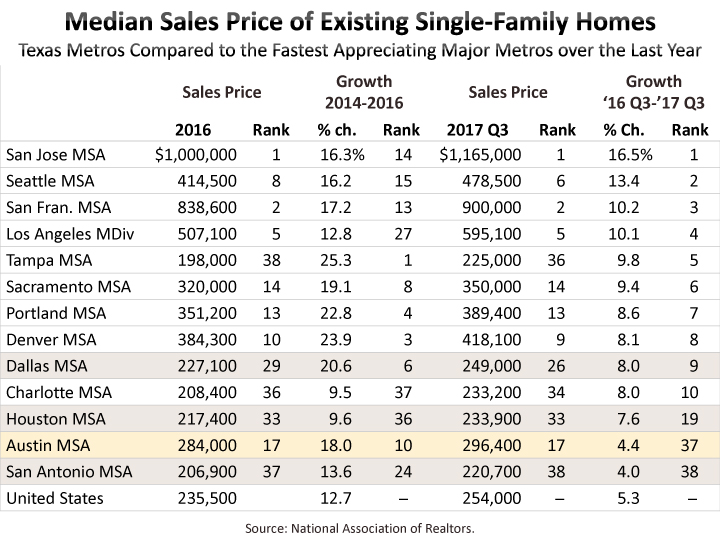
The National Association of Realtors produces a quarterly release of price data for existing single-family homes for about 180 U.S. metros. The following table indicates where Austin and the other major Texas metros stack up relative to the fastest appreciating markets among the 50 largest metros.[1] Austin is the 17th most expensive major metro in the latest quarter and the last calendar year. While Austin was in the top 10 for price appreciation between 2014 and 2016, over the last year, 36 major metros saw faster growth.
The Chamber’s Economic Indicators page includes an Excel spreadsheet (updated monthly) of Austin, Texas and national time series data for home sales and prices from the Real Estate Center at Texas A&M and the National Association of Realtors, as well as Housing Opportunity Index data from the National Association of Home Builders.
Footnote:
[1] Two large metros, Detroit and Pittsburgh, are not currently reported on in the NAR release.
Blog Photo credit: Garreth Wilcock via Foter.com / CC BY-ND
Related Categories: Central Texas Economy in Perspective