High tech industry
Posted on 08/06/2019 by Beverly Kerr
- Over 7,200 employers in the Austin metro area are in high tech industries.
- Jobs in Austin’s tech industries total 161,433, or 15.8% of all jobs, compared to 8.7% nationally.
- In 2018, jobs in Austin’s high tech industries grew by 6.6%, surpassing the metro’s 3.6% total job growth.
Annual average employment in high tech industries in the Austin MSA in 2018 was 161,433, up 6.6% from 2017. That’s a stronger gain than the 3.6% increase for employment across all industries. High tech jobs represent 15.8% of all Austin area jobs in 2018 and 27.7% of the year’s net new jobs. Nationally, high tech accounts for 8.7% of all jobs.

Over the last five years, employment in high tech industries has grown by 24.9%, compared to 20.7% for all industries in Austin. Over the last ten years, the gain for high tech (39.6%) also surpasses the gain for all industries (33.5%).

New industry data through the final quarter of 2018 was recently released by the Texas Workforce Commission (TWC) and the U.S. Bureau of Labor Statistics (BLS). The Quarterly Census of Employment and Wages (QCEW) produces much finer industry detail than the monthly Current Employment Statistics program and allows users to examine trends in distinct and narrow sectors like computer systems design or scientific R&D at the metro or even the county level. Since Austin is one of the most technology intensive metro economies in the U.S., we regularly examine new releases of QCEW to quantify the character and trends of Austin’s tech sector. To simplify the data for this look at the composition and currents of Austin’s tech sector, this article aggregates individual tech industries into several groupings—manufacturing; energy; trade; information and other IT; and engineering, R&D, labs/testing and other.[1]


There are 7,201 high tech employer firms in Austin. The number of tech firms grew by 362 or 5.3% in 2018. Total firms in Austin number 50,044 in 2018, up 1,676 or 3.5% over 2017. Over the last five years, the number of firms has grown 33.1% in high tech industries compared to 24.7% overall. High tech firms account for 14.4% of all firms in 2018, up from 13.5% five years ago and 13.0% ten years ago. Among Austin's high tech firms, 6.0% (433) are manufacturers and 94.0% (6,768) are in nonmanufacturing industries.

High tech payrolls in 2018 totaled $19.2 billion, or 30.1% of the Austin metro’s total payroll of $63.6 billion. Total payroll growth in 2018 was 8.1%, while the gain for high tech industries was 13.0%. High tech payrolls also have an edge over the last five years, gaining 53.3% compared to all payrolls gain of 43.8%. Over the last decade total payrolls are up 84.5% compared to 74.8% for tech payrolls.


For all industries, the average annual salary in Austin is $62,331, up 4.3% from 2017, while the average salary for high tech jobs is $118,743, up 6.1%. Since 2013, the all-industries average annual salary is up 19.2% and the average tech salary is up 22.8%. Over the last decade, the differential between all industries and tech is slighter—31.0% overall and 32.1% for tech. High tech salary growth in Austin primarily faltered relative to all industries in 2007 and 2013. In 2006, the average high tech salary was 199% of the average salary. The average high tech salary registered a low of 183% of the all-industries salary in 2014, but is at 191% in 2018.

Austin’s high tech employment is 23.1% manufacturing industries (37,262 jobs) and 76.9% nonmanufacturing industries (124,171 jobs). Jobs in high tech manufacturing gained 5.5% in 2018, but manufacturing’s share of Austin’s tech jobs has declined significantly over the long term. Before the last recession manufacturing accounted for over a third of Austin’s tech jobs. High tech’s share of all manufacturing jobs in Austin is 62.0% in 2018, unchanged from 2017.

Computer and electronic product makers (187 firms) dominate Austin’s high tech manufacturing jobs (26,971 or 72.4%). Of those jobs, 13,883 are in semiconductor and electronic components and 8,699 jobs are in computers and peripheral equipment. Pharmaceuticals and medicines manufacturing employs 2,105 and medical equipment and supplies manufacturing employs 1,154.
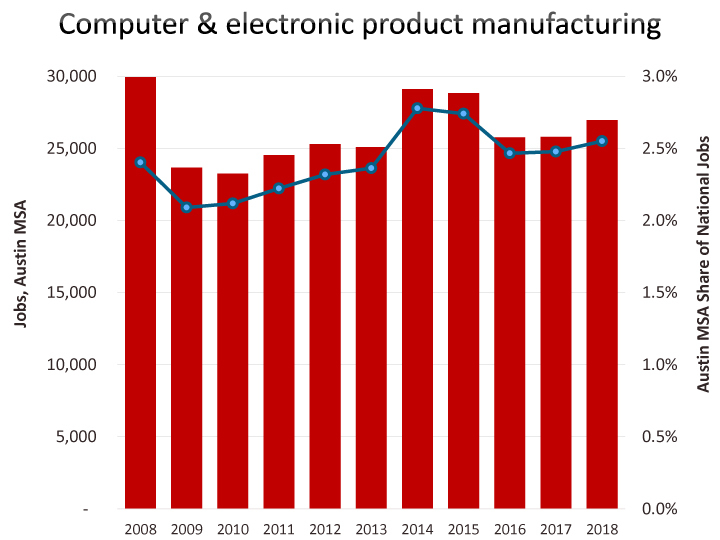
Austin has a location quotient (LQ) of 1.6 for the collection of industries making up high tech manufacturing, meaning that Austin employs workers in the sector at over one-and-a-half times the national rate.[2] Austin’s computer and electronics manufacturing industry employs workers at nearly four times (3.7) the national rate.
Salaries are higher in high tech manufacturing, $128,015, compared to the average of $115,961 in nonmanufacturing high tech industries. In Austin’s tech sector, manufacturing salaries have gained 11.5% over the last five years, while the nonmanufacturing average has risen 28.2%. Over the same period, the average salary for all industries rose 19.2%. Over the last year, salaries in high tech manufacturing rose 0.4%, high tech nonmanufacturing gained 8.1%, while the average salary for all industries increased 4.3%.
Nonmanufacturing high tech industries include subsectors of trade, information, professional and business services, and education and healthcare.
The high tech portions of the information industry include software publishers (193 Austin firms); motion picture and sound recording (244); telecommunications (124); data processing, hosting and related services (173); and internet publishing, broadcast and web portals (171). Other information technology (IT)-related industries include computer systems design and related services (3,046 firms) in the professional and business services sector and computer training (34) in the education sector. Combined, high tech information and other IT accounts for 67,340 jobs and 3,986 firms in Austin in 2018. Jobs in this group of industries are up 9.7% (5,952) in just one year, dominating the net jobs added (7,982) by nonmanufacturing tech industries in 2018. Computer systems design and related services[3] employs 39,221 and grew by 10.3%, or 3,652 jobs, in 2018.


Austin has a LQ of 2.2 for the group of industries we’re calling high tech information and other IT, meaning that Austin employs workers in the sector at more than two times the national rate.

The average annual salary in high tech information and other IT was $119,226 in 2018, with software publishing and computer systems design and related services being the best compensated industries ($131,342 and $133,914 respectively). Salary gains (8.2%) were above average (all industries grew 4.3% and all tech grew 6.1%) in 2018. The industry group gained 26.8% over the last five years, compared to 19.2% for all industries.
After computer systems design and related services, the next largest nonmanufacturing tech industry is computer/computer peripherals and software merchant wholesalers (162 firms) which employed 18,777 in Austin in 2018, down 241 jobs or 1.3% from 2017. This trade industry, together medical equipment merchant wholesalers, business-to-business electronic markets, and electronic shopping and mail-order houses represents 669 firms and 24,525 jobs in Austin’s high tech wholesale and retail trade industries. Average annual salary is $116,883 in 2018, up 8.4% over 2017.
Austin has 12.2% more high tech trade jobs in 2018 than it had in 2008, while jobs in the sector nationally are up by 23.0%. The driver of job growth nationally has been electronic shopping and mail-order houses. This industry has grown 62.2% over the decade, while computer and software merchant wholesaler jobs have declined by 9.4% nationally. As of 2018, electronic shopping and mail-order accounts for 44.7% of high tech trade jobs nationally. In Austin, electronic shopping and mail-order represents only 13.3% jobs in the grouping, and growth over the decade was slower, at 33.6%.

Austin is highly concentrated in high tech trade. Austin has almost four times the national concentration of jobs in this group and has more than 12 times the national concentration for jobs in computer and software merchant wholesaling. The other trade industries are also more concentrated in Austin, but less dramatically (with LQs of 1.2 to 1.7).
High tech energy (oil and gas extraction and electric power generation, transmission and distribution) is the smallest tech grouping in Austin with 143 firms employing 6,382 in 2018. Oil and gas extraction presently only accounts for 1,483 jobs, but growth has been robust—11.0% over the last year and 57.2% over the last decade. Oil and gas’ average annual salary is by far the highest $263,264 within tech (two small industries in the financial services sector have salaries topping $300,000).
Architectural and engineering services (1,217 firms), environmental consulting services (102), other scientific and technical services (257), scientific R&D services (226), medical and diagnostic laboratories (72), electronic and precision equipment repair and maintenance (116), and national security and international affairs (4) round out the remainder of the high tech sector. This grouping employed 25,924 in 2018, up 5.4% from 2017 and up 11.6% since 2013. Architectural and engineering services employs 15,424 of the total while scientific R&D employs 2,997. Austin’s LQ for this grouping we're calling "engineering, R&D, labs/testing and other services" is 1.1.


An Excel file of TWC data for Austin MSA establishments, firms, employment, payrolls, and average salary data for 2005-2018 for all of the high tech industry classifications referenced above, plus data for all other industry classifications is here. The file opens on an extract of the data for high tech industries as employed in this article. The other tab in the file contains data for all industries from major sectors to 6-digit NAICS. The data in the file is “total,” i.e., represents private and public employers. A third tab in the file contains national employment data from the BLS for 2008-2018 for high tech industries.
FOOTNOTES:
- QCEW estimates are derived primarily from the reporting of private business and government agencies under the unemployment insurance program. While all states produce similar data from the program, how much of the data different states publish in terms of industry detail, periods published, and geographic regions reported varies. TWC’s data begins in 1990, and for Austin in 2018, estimates are published for over 1,260 industry classifications. The U.S. BLS also publishes a database of QCEW data for all U.S. counties, metros and states, however, the level of industry detail available at the local level is often more limited than desirable for estimating the tech sector, hence the omission of metro comparisons from this article. ↩
- Industry LQs are calculated by comparing the industry’s share of regional employment with its share of national employment. High tech manufacturing represents 3.7% of jobs in the Austin MSA, compared to 2.3% nationally. 3.7 divided by 2.3 yields a LQ of 1.6. ↩
- Computer systems design and related services (NAICS 5415) includes custom computer programming services (23,880 jobs), computer systems design services (14,295 jobs), computer facilities management services (309 jobs), and other computer related services (737 jobs). ↩
Related Categories: Central Texas Economy in Perspective