Job Growth & Unemployment
Posted on 08/02/2016 by Beverly Kerr
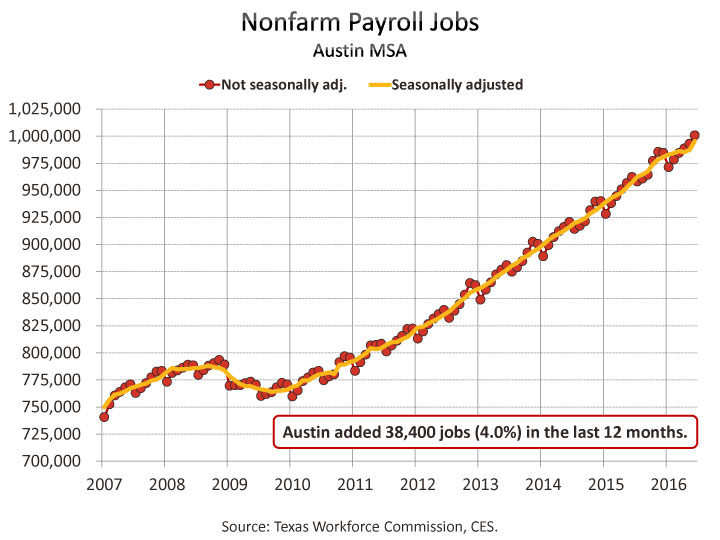
- Austin added 38,400 net new jobs, growth of 4.0%, in the 12 months ending in June, making Austin the fourth fastest growing major metro.
- Jobs in the five-county metro topped one million for the first time with the June estimate.
- Professional and business services added the most jobs (7,900 or 4.9%) in the past year, however, the fastest growing industries are construction and natural resources (10.8%) and wholesale trade (10.3%).
- Austin's seasonally adjusted unemployment rate is 3.1%, unchanged from May.
The Austin metropolitan area added 38,400 net new jobs, or 4.0%, in the 12 months ending in June, according to the recent release of preliminary payroll jobs numbers by the Texas Workforce Commission (TWC) and the U.S. Bureau of Labor Statistics (BLS). June’s estimate for total nonfarm payroll jobs is 1,000,800. This is the first occasion the 5-county metro’s total has topped one million.
Austin’s 4.0% growth makes it the fourth best performing among the 50 largest metro areas. Fort Lauderdale and Orlando, both growing by 4.5%, topped the ranking. Dallas, at 4.1%, was the third fastest growing job market. The other three major Texas metros missed the top 10. San Antonio grew by 2.4% (30th), Fort Worth grew by 1.4% (44th), and Houston grew by 0.2% (50th) between June 2015 and June 2016.

For the year ending in June, private sector job growth in the Austin MSA is 4.5%, or 35,700 jobs, and with all private industry divisions, except manufacturing, contributing to the growth. Austin's sizable government sector (nearly 18% of jobs) saw modest growth over the last 12 months, gaining 2,700 jobs or 1.6%, thus bringing the overall job growth rate to 4.0%.
Texas saw weaker net private sector job growth of 1.3% with eight of eleven private industry divisions adding jobs over the last 12 months. The government sector, which accounts for over 16% of total state employment, grew faster, 2.5%. Overall job growth was 1.5%. For the nation, private sector growth is 2.0% for the 12 months ending in June, with all private industries, but manufacturing, adding jobs. Overall job growth is a more modest 1.8% because the government sector gained only 0.5%.

Jobs in June are up from May by 7,800 jobs or 0.8% in the not-seasonally-adjusted series for Austin. This month the seasonally adjusted change happens to be similar—jobs are up by 7,900 or 0.8%. Seasonally adjusted jobs are unchanged in Dallas and Houston, and down 0.1% in Fort Worth and down 0.3% in San Antonio. Statewide, seasonally adjusted jobs are up 7,200 or 0.1% in June. Nationally, seasonally adjusted jobs up 0.2%.

In Austin, the industry adding the most jobs over the last 12 months is professional and business services which grew by 7,900 jobs, or 4.9%. Construction and natural resources grew fastest at 10.8% (6,000 jobs), followed by wholesale trade at 10.3% (4,900). Also growing at faster-than-average rates are leisure and hospitality (4.8% or 5,700 jobs) and education and health services (4.7% or 5,200 jobs). Manufacturing lost 4.1% or 2,400 jobs.

Statewide, leisure and hospitality grew fastest, 4.5%, and added 57,900 jobs. Education and health services added the most jobs, 59,700 jobs and grew 3.8%. The other relatively fast growing private industries include financial activities (2.5%), wholesale trade (2.4%), and retail trade (2.3%). Jobs in construction and natural resources lost 43,300 jobs or 4.5% and manufacturing declined by 34,800 or 3.9%. Transportation, warehousing and utilities saw a slighter decline (700 jobs or 0.1%) as well over the last 12 months.
Nationally, education and health services grew fastest, adding 3.0% over the 12 months ending in June. The other industries growing at faster than average rates were leisure and hospitality (2.8%), professional and business services (2.7%), financial activities (2.1%), retail trade (2.0%), and information (1.7%). Manufacturing jobs declined by 0.3%.
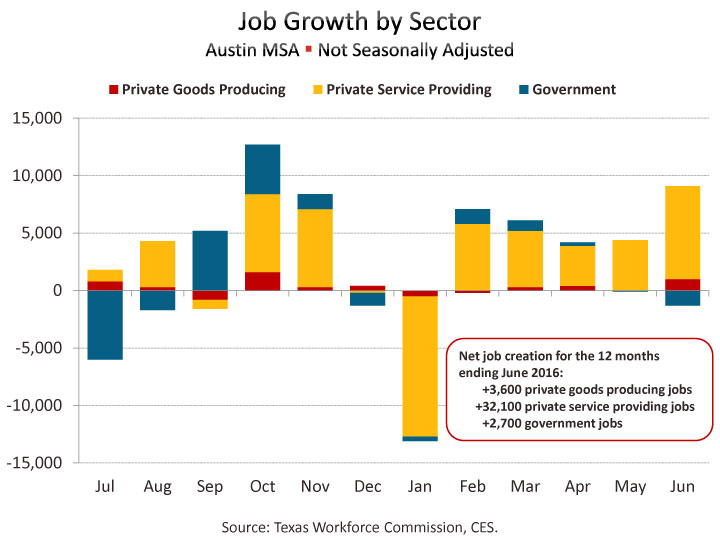
The net gain for private service-providing industries in Austin is 32,100 jobs, or 4.7%, over the last 12 months. Employment in goods producing industries is up by 3,600 jobs or 3.2%. Statewide, private service-providing industries are up 204,900 or 2.5%, but goods producing industries are down 78,100 jobs or 4.2%.
See sidebar discussion below about alternative jobs estimates for Austin.
We also now have June labor force, employment, and unemployment numbers for Texas and local areas in Texas. The same data for all U.S. metros that we often do a ranking of will not be released until August 3. In May, Austin had the second lowest rate of unemployment among the 50 largest metros and San Francisco had the lowest.

Unemployment numbers for June show Austin’s performance relative to the state and other major Texas metros being sustained. In June, Austin is at 3.3%, while the other major metros range from 3.9% in Dallas to 5.5% in Houston. San Antonio is at 4.0% and Fort Worth is at 4.2%. Austin’s rate one year ago was 3.6%. The rates in Dallas, Fort Worth and San Antonio are also improved from the rates seen a year ago. Houston has seen its unemployment rate increase (from 4.8%). The statewide not-seasonally-adjusted rate is now 4.8%, up from 4.7% in June of last year. The U.S. unemployment rate is 5.1%, improved from 5.5% a year ago.
In 2007, before the impact of the Great Recession, unemployment averaged 3.6% in Austin, 4.3% in Texas, and 4.6% nationally. Unemployment has been at or below pre-recession levels for 17 months in Austin. Texas’ year-to-date average (4.4%) is just above what it averaged in 2007. The nation, with unemployment averaging 5.0% in 2016, has yet to regain its pre-recession level of unemployment.
Within the Austin MSA, Travis County has the lowest unemployment rate in June, at 3.2%, while Caldwell County has the highest at 4.6%. The rate is 3.4% in Williamson County, 3.6% in Hays County, and 4.1% in Bastrop County.
On a seasonally adjusted basis, Austin’s June unemployment rate is 3.1%, unchanged from May. The last time, before this year, that Austin saw 3.1% seasonally adjusted unemployment was February 2001, before the impact of the “dot-com” recession. The statewide rate is 4.5%, up from 4.4% in May. Nationally, the seasonally adjusted unemployment rate is 4.9%, up from 4.7% in May.

Among Texas major metros, Dallas has the next lowest seasonally adjusted rate at 3.8%, while Fort Worth, San Antonio and Houston are at 3.9%, 4.0%, and 5.3% respectively. While Austin’s June rate is unchanged from May, the other major metros have increased unemployment, with rates up by 0.1 to 0.5 percentage points. Seasonally adjusted unemployment rates for Texas metros are produced by the Federal Reserve Bank of Dallas. (The TWC also produces seasonally adjusted rates for Texas metros, but publication lags the Dallas Fed’s data.)

With Austin’s unemployment rate down from one year ago, the number unemployed has also declined. In June 2015, Austin’s number of unemployed was 38,408. Over the last 12 months, the unemployed have decreased by 1,242 or 3.2%, to 37,166. The number of unemployed in Austin averaged more than 60,000 for three years running during the Great Recession.

The Austin metro’s civilian labor force (employed plus unemployed) has increased by 3.4% or 36,504 persons from one year ago, while persons employed increased by 3.6% or 37,746. Texas saw 1.6% growth in labor force and 1.5% in employed, while the number unemployed increased by 3.5% or 21,639. Nationally, June civilian labor force is up by 1.2%, while employed is above the level of a year ago by 1.6%, and 494,000 fewer people (5.7%) are unemployed.
Texas Workforce Commission will release July estimates on August 22.
The Chamber’s Economic Indicators page provides up-to-date historical spreadsheet versions of Austin, Texas and U.S. data for both the Current Employment Statistics (CES) and Local Area Unemployment Statistics (LAUS) data addressed above.
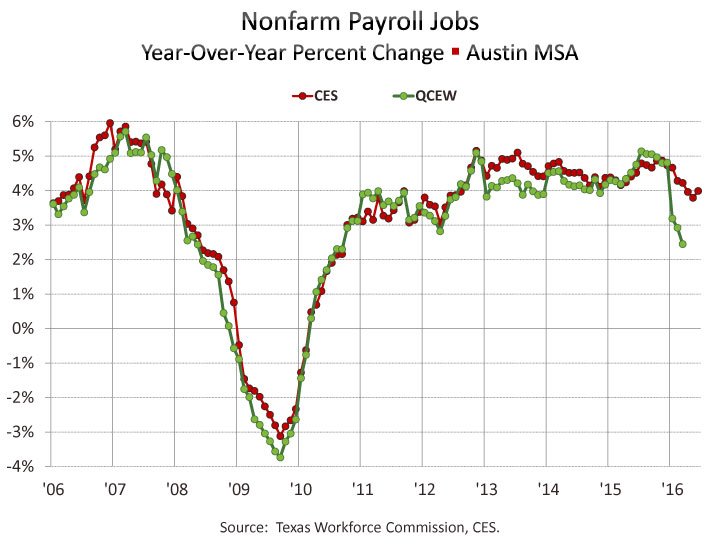
Our monthly review of trends in payroll jobs estimates focuses on the data produced by the Current Employment Statistics (CES) program. CES data is produced by a sample survey and estimates are subject to revision. The key input to the annual benchmark revision of the CES sample survey estimates, which occurs each year in March, is the Quarterly Census of Employment and Wages (QCEW). QCEW releases considerably lag CES estimates, so the data is less commonly treated in media reports than the more up-to-the-moment CES data.
QCEW is based on administrative records for workers covered by state and federal unemployment insurance. CES estimates include these workers as well as supplemental estimates for some industries that have workers that are not covered by unemployment insurance.
While there are differences in the workforce represented by QCEW and CES, the arrival of new QCEW data is an occasion to check up on the CES estimates. Sometimes QCEW signals that Austin’s payroll jobs may be growing faster than CES indicates and at other times it signals that growth might be slower.
QCEW data for the first quarter of 2016 and revised data for 2015 was recently released. While CES indicates that job growth between the first quarter of last year and the first quarter of this year to be 4.4%, QCEW is showing growth of only 2.9%.
The Dallas Federal Reserve Bank produces its own version of seasonally adjusted monthly CES estimates for Texas metros by incorporating revisions based on QCEW releases on a quarterly basis. Given that we typically examine Austin’s performance relative to other major U.S. metros in these Central Texas Economy articles, we don’t typically incorporate the Dallas Fed series due to data comparability, however, it is definitely an important alternative to examine. The graph below compares their seasonally adjusted and "early benchmarked"series to the TWC/BLS seasonally adjusted estimates.

The Dallas Fed discusses the impact of their "early benchmarked" estimates on their Texas employment forecast. They also note that there are signals that the state's growth in the second half of 2016 will be better.
The Chamber's Economic Indicators Excel file of the CES statistics also includes sheets providing the alternative Dallas Fed and QCEW jobs series.
Related Categories: Central Texas Economy in Perspective