Occupational Employment & Wages
Posted on 04/11/2017 by Beverly Kerr
- Austin’s average annual salary for all occupations in 2016 is $50,830, 2.4% above the national average, and the median salary is $37,800, 2.1% above the national median.
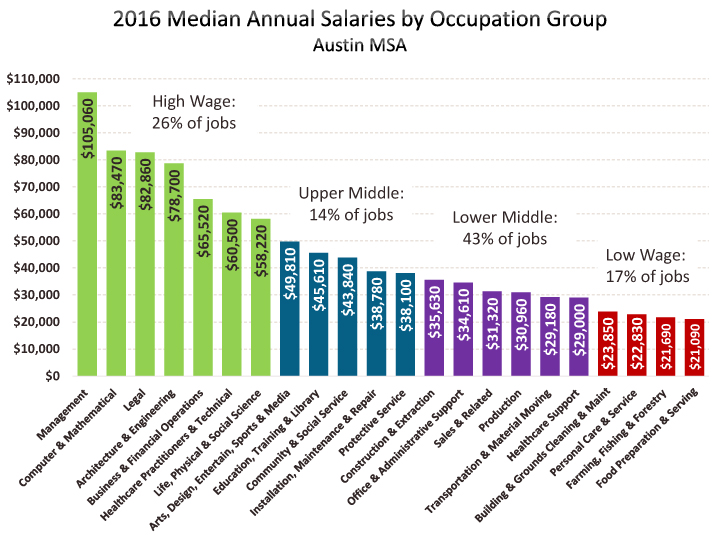
- Among the major classes of occupations, median annual salaries in Austin range from $21,090 for food preparation and serving occupations to $105,060 for management occupations.
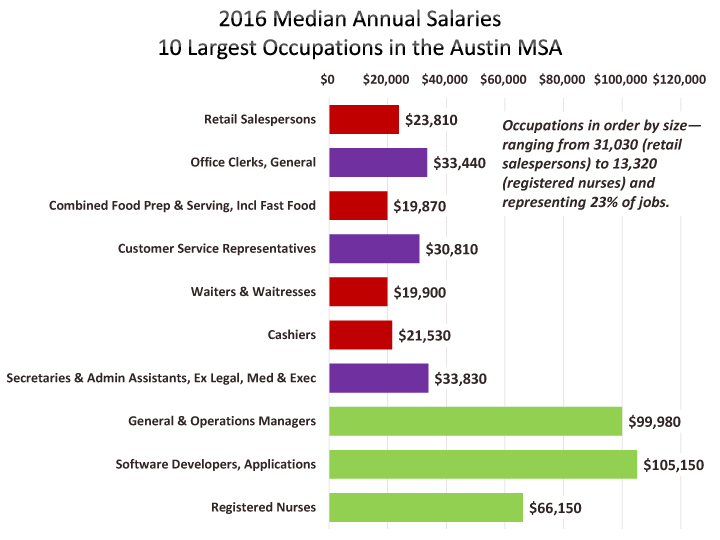
- Median annual pay for three of Austin’s 10 largest occupations exceeds $65,000.
New data released March 31th by the U.S. Bureau of Labor Statistics provides estimates of 2016 employment and salaries by occupation. While there are alternative sources for employment by occupation for metropolitan areas, no publically accessible source of salary data is more comprehensive than this survey. Estimates from the Occupational Employment Statistics (OES) program are available for the nation as a whole and for over 500 other areas. Over 800 occupations are covered in the survey, with over 600 of those available for the Austin MSA. The OES survey is sent to more than 600 Austin-area employers every May and November and is vital as the foundational data needed to quantify pay and employment for occupations.
Austin’s average annual salary for all occupations in 2016 is $50,830, 2.4% above the national average, and the median salary is $37,800, 2.1% above the national median. Among the 50 largest metros, Orlando has the lowest median annual salary—$31,410 (15.2% below the national median)—and San Jose has the highest—$59,700 (61.2% above the national median). Austin’s median salary ranks as the 22nd lowest among large metros. Dallas ranks 28th, with a median annual salary that is 3.7% above the national median and Houston ranks 29th with a salary that is 3.9% higher. San Antonio and Fort Worth have median annual salaries below the national median, 8.5% and 5.2% lower respectively. San Antonio’s median is the third lowest among major metros and Fort Worth’s is ninth lowest.

It is important to note that these average and median salaries in different labor markets are driven in part by the differences among areas in occupational composition, establishment, and occupational characteristics. Simple pay comparisons calculating the ratio of the average pay for an area to the entire U.S. in percentage terms does not control for interarea differences in occupational composition and other factors which may impact pay relatives. The BLS formerly produced occupational pay relatives that controlled for such differences to isolate the geographic effect on wage determination, but it no longer does. In 2010, the last year of this data published, Austin’s all occupations pay relative was 6% below the nation.
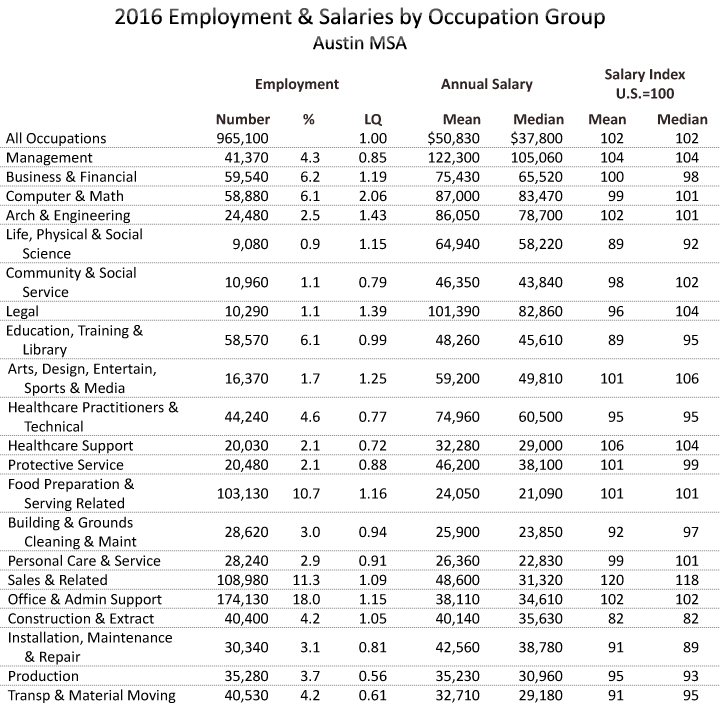
Note: For an explaination and discussion of "LQs" or location quotients referenced in the table above,
see paragraphs preceding the final three bar graphs below.
Among the major classes of occupations, median annual salaries in Austin range from $21,090 for food preparation and serving occupations to $105,060 for management occupations. About 4.3% of workers in Austin (41,370) are employed in management, while more than twice that are employed in food preparation and serving (10.7% or 103,130).
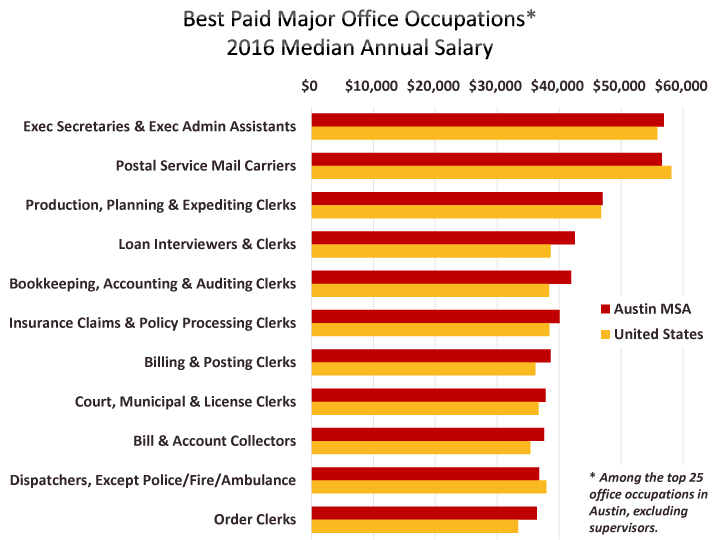
For each occupation group, the OES survey offers salary data for numerous individual occupations. Within “management,” for example, 34 unique occupations are reported. There are 56 unique occupations in “office and administrative.” For each occupation, hourly wages and annual salaries are available as averages and by percentile (10th, 25th, 50th or median, 75th, and 90th). A complete set of 2016 OES data for Austin and the U.S.[1] is in an Excel file here.
Based on the median salary of $153,870, marketing managers are the highest paid management occupation in Austin (excluding chief executives), followed by architectural and engineering managers at $150,010. Based on average salaries, the same two occupations also lead with salaries of $161,970 and $161,550 respectively.
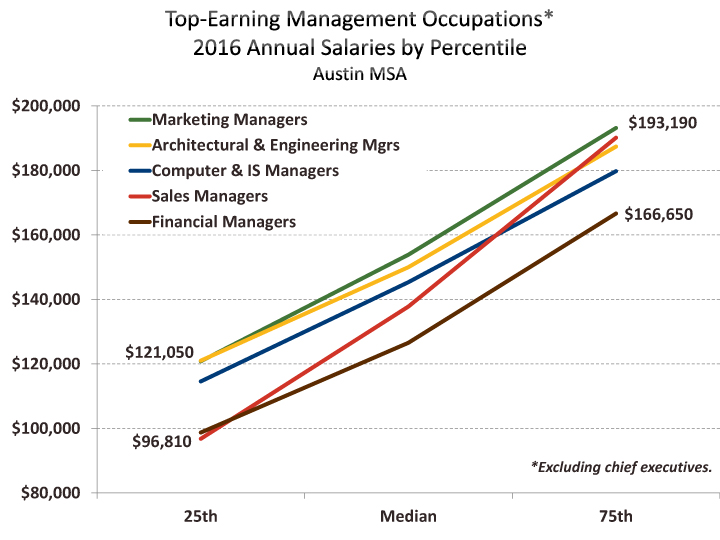
Wage distributions for the three highest paid management occupations are roughly similar (a 55%-60% difference between 25th and 75th percentile wages). However, for the next best compensated occupation, sales managers, there is a 96% difference between 25th percentile and 75th percentile workers.
Within computer occupations (nearly 59,000 jobs), the most remunerative occupations in Austin are computer network architects ($121,360 average salary), information security analysts ($104,680), and software developers ($100,740 for systems developers and $102,270 for applications developers). Applications software developers is the largest computer occupation in Austin (13,380 jobs). An entry salary might be about $55,510 based on the 10th percentile, the median is at $105,150, and earnings range to $150,060 for the top 10%. In San Jose, the 10th percentile of applications software developers earn $82,440 and median salary is $129,540. The 90th percentile salary is $193,340. While San Jose’s median salary exceeds Austin’s by only 23%, the average salary is 30% higher, in part due to 49% higher salaries at the 10th percentile.
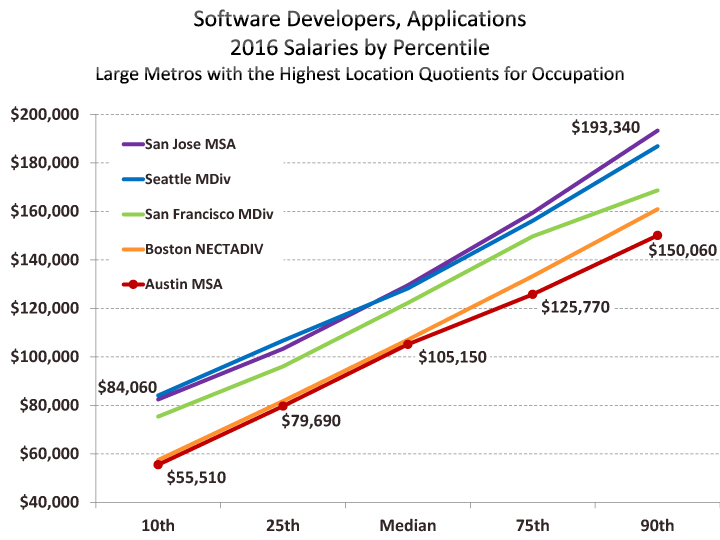
For all computer and mathematical occupations, Austin's median salary is about 69% of San Jose’s median. This is not far from the differential between the metros' median salaries for all occupations (63%), however, the difference varies substantially for other classes of occupations. For example, the median annual salary for protective service occupations in Austin is 92% of the San Jose median.

In the engineering field (24,480 jobs in Austin), petroleum engineers earn the largest salaries by a wide margin. In Austin, they average $145,750 in annual salary, or a median of $126,930, levels close to the occupation’s salary nationally. However, there are not a large number of such jobs in Austin.[2] Dominate engineering occupations in Austin include civil, electrical and electronics engineers (3,050, 2,890 and 2,100 employees respectively), as well as electrical and electronics engineering technicians (3,000). The median salary for civil engineers is $80,420, about 3.7% below the national median. Both electrical and electronics engineers earn in excess of national rates. The median salary in Austin is only 1.7% greater for electronics engineers ($100,870) but 21.4% higher for electrical engineers ($114,330). Electrical and electronic engineering technicians earn a median salary of $61,270—about 1.5% below the national median.
Sales and related occupations, which employ nearly 109,000 in Austin, have an average salary 20% above the national average and a median salary that is 18% above the national median. No other occupation group in Austin exceeds national salaries to this degree.
Retail sales persons are 28% of this group (over 31,000) and their average salary is 3% higher in Austin. Cashers (nearly 20,000 or 18% of the group) exceed the national average by 2%. Wholesale and manufacturing sales representatives, which are divided into two types (“technical and scientific” and “except technical and scientific”), account for 17,500 jobs in Austin and 16% of all sales jobs. In Austin, the average salary of the larger “technical and scientific” sales representative occupation is 23% above national average. Also contributing the sales occupation group’s higher than average salaries in Austin are real estate sales agents (24% higher) and parts sales persons (21% higher).

Construction and extraction occupations (40,400 jobs in Austin) and education, training and library occupations (58,570) are the occupation groups with the greatest negative differential between salaries in Austin and national salaries.
Construction and extraction occupations pay 18% less in Austin than nationally. For the largest occupation, construction laborers (7,790), Austin’s average salary is $28,940 compared to $37,890 nationally (24% lower). The median is $28,150 here, compared to $33,430 nationally (16% lower). The next largest occupation, supervisors (5,060), earn much closer to national rates—the average salary is $61,690 (6% lower) and the median is $59,040 (9% lower).
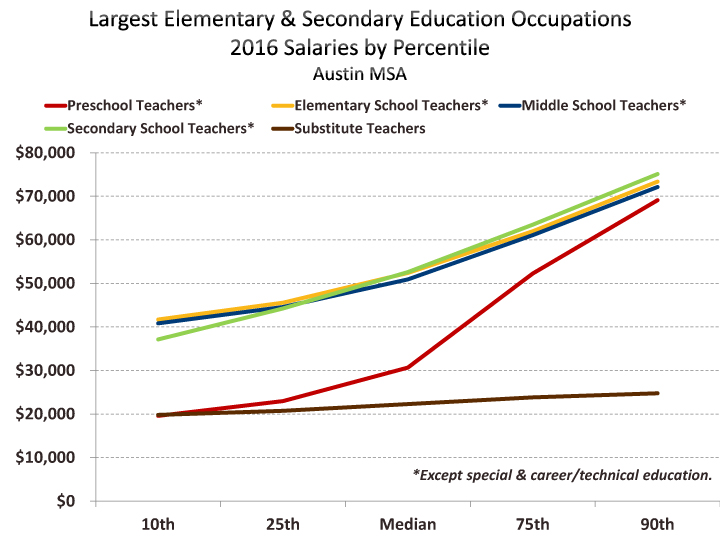
Education, training and library occupations earn an average salary of $48,260 (11% below the national) or a median salary of $45,610 (5% below). Among the largest individual teaching occupations, elementary school teachers are paid closest to their national peers, with an average salary in Austin ($54,390) only 8% below the national average.

Location quotients are a useful byproduct of the survey’s employment estimates. The location quotient (LQ) represents the ratio of an occupation’s share of employment in a given area to that occupation’s share of employment in the U.S. as a whole. For example, an occupation that makes up 10% of employment in a specific metropolitan area compared with 2% of U.S. employment would have a location quotient of 5 for the area in question.
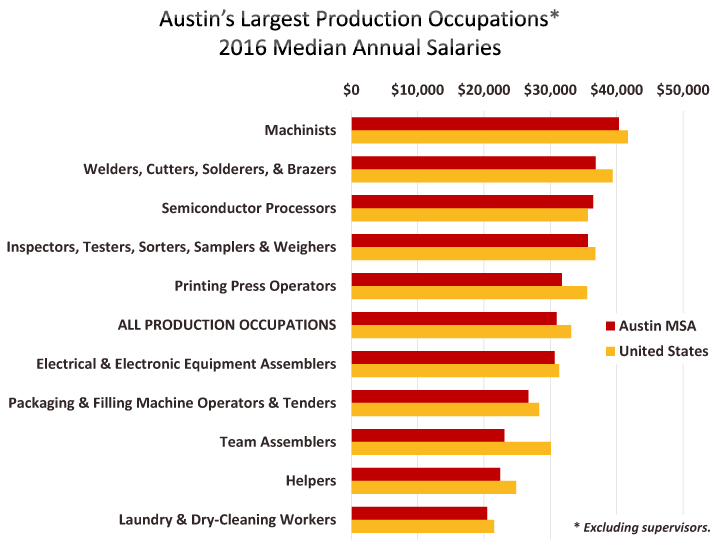
For the major occupations groups, Austin’s highest LQs are computer and math occupations (2.06) and architecture and engineering (1.43). One of Austin’s lowest major group LQs is for production occupations (0.56), however, among individual occupations, Austin’s highest LQ is 6.45 for semiconductor processors. The state and federal presence in Austin means that the next largest LQ (5.30) is held by tax examiners/collectors and revenue agents. And given the outsize influence of the University of Texas, it turns out that, graduate teaching assistants have the next largest LQ (4.90) and the occupation accounts for 4.7 of every 1,000 Austin jobs.
The OES survey is a semiannual mail survey measuring occupational employment and wage rates for wage and salary workers in nonfarm establishments in the United States. OES estimates are constructed from a confidential sample of 1.2 million establishments. May 2016 estimates are based on responses from 6 semiannual panels of 200,000 establishments each collected over a 3-year period. Combining multiple panels of data reduces sampling errors, particularly for small geographic areas and occupations. Wages for the current period need no adjustment, however wages for the previous panels are adjusted to the current panel’s reference period using wage movements from a BLS program called the Employment Cost Index.
Wages and salaries in the OES survey are straight-time, gross pay, exclusive of premium pay. Base rate; cost-of-living allowances; guaranteed pay; hazardous-duty pay; incentive pay, including commissions and production bonuses; and tips are included. Excluded are overtime pay, severance pay, shift differentials, nonproduction bonuses, employer cost for supplementary benefits, and tuition reimbursements. “Employees” are all part-time and full-time workers who are paid a wage or salary. The survey does not cover the self-employed, owners and partners in unincorporated firms, household workers, or unpaid family workers.
While the OES survey has produced annual estimates of employment and wages for many years, this article does not use the data to consider changes in employment and wages over time. The BLS offers a lengthy discussion of the limitations of this survey for producing viable time series.
FOOTNOTES
[1] The U.S. data in this Excel file is a complete set of the “cross-industry” estimates corresponding to what is reported for metropolitan areas. At the national level, additional data is available, including industry-specific estimates.
[2] According to this survey, the number of petroleum engineers may be 190. However, it should be noted that employment estimates in the OES survey can have extremely high error statistics and this is one of those. The survey provides relative standard error (RSE) statistics for the employment and wage estimate for each occupation for an area. In general, for the Austin MSA, a relatively small portion of the wage estimates will have a large RSE, however the employment estimates for individual occupations (as opposed to occupation groups) are dominated by substantial RSEs.
Related Categories: Central Texas Economy in Perspective