Housing Market
Posted on 03/24/2015 by Beverly Kerr
The number of homes sold in the Austin metropolitan area in the first month of 2015, 1,682, is 6.3% greater than the number sold in January 2014. Austin’s dollar volume of sales is 22.3% higher and the median home price, at $238,500, is up 11.6%. The average price in January 2015 was $310,000, up 15.1% from one year ago, and average prices have been consistently above $300,000 for 10 months.
The close of 2014 showed the year made a moderate 1.5% gain in sales over 2013, while the dollar volume of sales gained 8.2%, and the median price, at $240,000, was up 8.1%. The average price of homes sold in 2014 was $305,500, 6.6% above the average price of 2013.
Activity & Inventory
Austin’s existing home sales in January totaled 1,682, 6.3% above the number of homes sold in January 2014, but 31.3% below the total for last month, according to the latest numbers from the Austin Board of Realtors and the Real Estate Center at Texas A&M. That December to January drop is on par with the historical December to January pattern in the Austin market. Sales for 2014 (30,885) were up 1.5% over 2013.

National Association of Realtors data for the U.S. show home sales were down 2.9% in 2014 and January 2015 is 0.4% ahead of last January. Statewide, 2014 sales were 3.0% above 2013 and the January 2015 total is 3.4% ahead of last January.

The dollar volume of 2014 sales was up 8.2% from 2013 for the Austin metro, up 9.8% state-wide, up 0.9% nationally. For January 2015, the value of Austin sales are up 22.3% over last January, while Texas is up 13.1% and the nation is up 5.3%.

Austin’s months of inventory on the market measure averaged 2.5 months in 2014, down from 2.6 in 2013. Statewide, the average in 2014 was 3.5 compared to 4.0 in 2013, and nationally, the months of inventory rose to 5.2 in 2014 from 4.9 in 2013. In January, Austin’s supply was 2.2, unchanged from December, but up from 2.0 a year earlier. Austin has had less than three months inventory on the market since December 2012. The only other years in which inventories dipped as low were 1999 and 2000. A balanced supply is considered to be six months.
The months of inventory calculation is derived from the number of homes sold and the number of active listings. There was a monthly average of 6,308 listings on the market in 2014, up 3.3% from 2013, but that is fewer listings than any year from 2001 through 2012, even though sales have reached a new all-time high. January 2015’s active listings, 5,567, are 8.8% above last January.
Prices
Austin’s median home price in January is $238,500, down from the December by 2.9% and up from one year ago by 11.6%. In 2014, the median price was $240,000, 8.1% above 2013. (A map of 2014 median home prices for different submarkets through the metro area is here.) Austin’s median has exceeded $200,000 each month since February 2013, and has stayed above $230,000 for the last 11 months.

In 2014, 63.5% of homes sold in Austin were at prices above $200,000, up for 56.9% in 2013 and 50.9% in 2012.

In 2014, Austin’s median price exceeded the state median by over 30% for the first time. The differential between Austin and the state approached this level just before the dot-com recession. After falling each year through 2005, the difference climbed sharply through 2009.

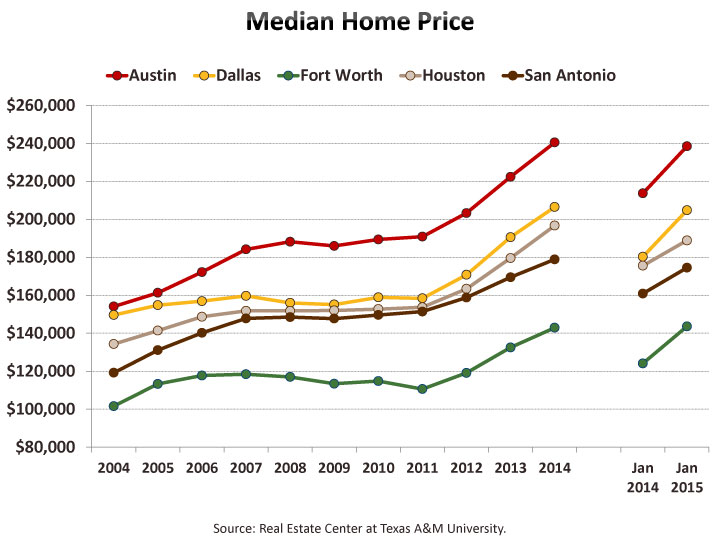
Dallas’ median sales price in 2014 was $206,500, up 8.3% over 2013. Fort Worth’s price is $142,900, up 7.8%; Houston has a median price of $196,700, up 9.5%; and San Antonio is at $178,900, up 5.5% over 2013. The national median price for 2014 was $208,300, which is 5.7% more than 2013. In January, Austin’s year-over-year change was 11.6%. Dallas and Fort Worth saw greater gains, 13.6% and 15.7% respectively, while Houston and San Antonio saw smaller gains, 7.6% and 8.5% respectively.
The average price in Austin in January, at $310,000, is up 0.6% from December and up 15.1% from a year ago. In 2014, Austin’s average sales price was $305,500, 6.6% higher than the $286,600 average of 2013. For Texas, the average price in 2014 was $239,800, up 6.6% from 2013, and January’s average is up 9.4% over January 2014.The national average price for 2014 is $255,300, 4.0% over 2013, and January’s average is 4.9% above last January.

National Association of Home Builders’ Housing Opportunity Index (HOI) incorporates data on local incomes, taxes and insurance rates, together with home prices, to represent the relative affordability of U.S. housing markets. The HOI represents the share of homes sold in an area that would be affordable to a household earning the local median family income.
While Austin’s home prices are higher than Texas’ other major metros, and our median has exceeded the national median since the housing bubble burst, the HOI measure shows Austin’s affordability tracking closely to the national rate over the last two quarters. Compared to Texas major metros over the last few years, Austin has only been decisively less affordable than Fort Worth.

A household earning Austin’s $75,400 median family income could afford to purchase 61.5% of homes sold in the fourth quarter of 2014, while a family earning the national median family income of $63,900 could afford to buy 62.8% of homes sold nationally. In the previous quarter, Austin’s HOI of 61.2 was closer to the national HOI of 61.8. Austin has been more affordable than Dallas and Houston for the last three quarters and more affordable than San Antonio for the last two quarters.
Home price indexes from the Federal Housing Finance Agency offer a view of the change in single-family (*) home prices on a quarterly basis. Their 2014 Q4 release, which became available late last month, provided metro comparisons of the current quarter to last quarter, one year ago, and five years ago. The downloadable data for Austin is a quarterly price index that begins in 1977. The third quarter of 2008 was Austin’s peak before home prices began faltering locally and 2014 Q4 is 29.8% above that level. Nationally, home prices have increased each quarter since the third quarter of 2011, and presently stand 4.9% below the first quarter 2007 peak.

Only 15 of the 100 largest metros still have price levels below what they were 5 years ago. House prices have gained 30.7% over the last 5 years in Austin, ahead of Texas’ price appreciation of 21.0%. Austin also leads the state over the last year (9.9% vs. 6.4%) and the last quarter (2.2% vs. 1.2%). However, Houston leads Texas metros for both 5-year change (37.1%) and 1-year change (11.0%).


Footnotes:
(*) Note that FHFA price data is based on single-family homes only. The preceding paragraphs discussed price and sales trends for single-family homes, townhouses and condominiums.
The Chamber’s Economic Indicators page includes an Excel spreadsheet (updated monthly) of Austin, Texas and national time series data for home sales and prices from the Real Estate Center at Texas A&M and the National Association of Realtors, as well as Housing Opportunity Index data from the National Association of Home Builders.
Related Categories: Central Texas Economy in Perspective