American Community Survey – Workforce Demographics
Posted on 02/24/2015 by Chris Ramser
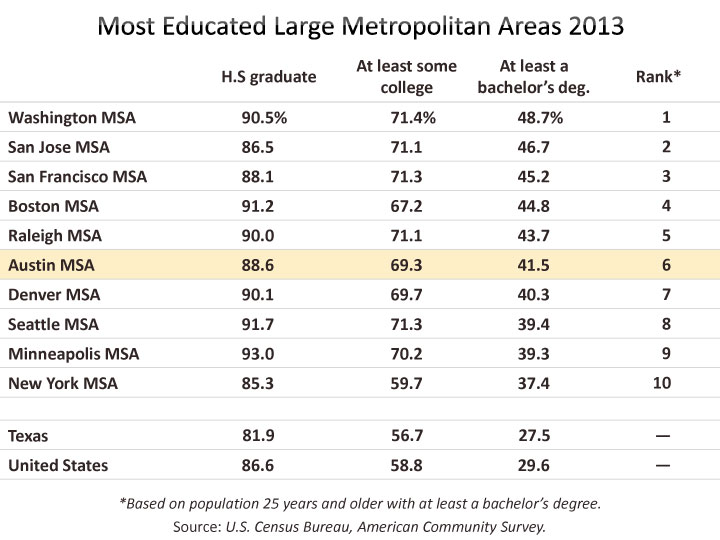
The Austin MSA ranks sixth among the top 50 metros for having the most educated population as measured by the percent aged 25 and above with at least a bachelor’s degree. Austin, with 41.5% of its population holding a bachelor’s degree trailed only Washington D.C., San Jose, San Francisco, Boston, and Raleigh. Dallas-Ft. Worth, with a bachelor’s attainment rate of 32.6%, is the next best performing Texas metro and ranks 22nd. Houston places at 30th with 30.9% and San Antonio 47th with 26.7%. This data, from the U.S. Census Bureau’s American Community Survey (ACS), is available annually each September for geographies with 65,000 or more population, while multi-year estimates aggregating 5 years of data are available for smaller areas released each December.(1)
The ACS 5-year estimates provide the opportunity to look at characteristics of the population at the sub-city level. Data is collected from roughly one out of every 38 households per year, with the Census Bureau aggregating five years of results to produce small area estimates, albeit still with sometimes large margins of error. For this article, the maps and data cover the general topic of talent and workforce including measures of educational attainment, unemployment, field of degree, and occupation. Each map shows essentially the “average” characteristic in that area over 2009-2013. If you missed last year’s ACS five-year data mapping article, which covered the topic of housing, you can find it here.
Educational Attainment
Educational attainment remains a critical issue for the success of the region in attracting new jobs and for an individual resident’s career and earnings potential. In 2013, Austin MSA bachelor’s degree holders earned a median of $49,564, which was $23,351 or 89.1% more than those who only completed high school. Those who earned a high school diploma or equivalent earned a median income of $26,213, or about $4,850 more than those who did not finish high school.
Population Aged 25+ with a High School Diploma or Equivalent
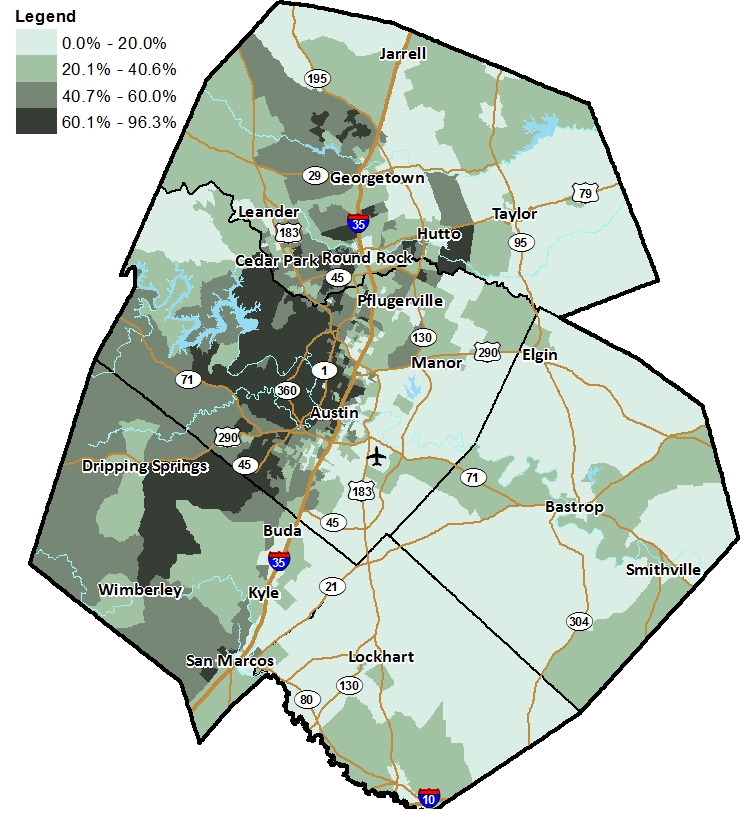
With high school graduates making up 88.6% of the population in 2013, the Austin MSA outperformed both the state and nation which had rates of 81.9% and 86.6%, respectively. For the 2009-2013 period, the Austin MSA’s high school completion rate stood at 88.0%. The map below shows the variation in the rate across the region. There are a total of 967 census block groups within the Austin MSA with an average population of 1,842. The two lightly-shaded green colors on the map represent block groups with rates of high school graduates below the metro’s rate of 88.0%, while the two darkly-shaded colors represent block groups with rates above 88.0%. The lowest category mapped, 75.0% and below, included 181 block groups of which 151 were located along or to the East of I-35. The highest category mapped included 402 block groups with above 95.0% high school completion, while 198 of those areas had above 99%.

Population Aged 25+ with a Bachelor’s Degree or Higher
For the 2009-2013 period, 40.6% of the Austin MSA’s population 25 years and over has at least a bachelor’s degree. The geographic distribution across the metro is relatively similar to the high school attainment map above. The two lightly-shaded green colors on the map represent block groups with rates of college graduates below the metro’s rate of 40.6%, while the two darkly-shaded colors represent block groups with rates above 40.6%. The lowest category, with attainment of 20.0% or less, consists of 231 block groups, while the second lowest break represents 274. The highest two categories are above the region’s rate and represent 240 and 222 block groups, respectively. Eleven block groups have bachelor’s completion rates at 90% or higher, nine of those are in West or Central Austin between the Colorado River and 35th Street, while the other two are in Southwest Austin off of Loop 360 and far Northwest Austin.
Unemployment Rate
In addition to enjoying higher earning potential, those completing higher education are also less likely to be unemployed. In 2013 the ACS reported a civilian unemployment rate in Austin for the working population aged 25-64 with less than a high school diploma at 7.6%, compared to an unemployment rate of 3.6% for bachelor’s degree earners. High school grads fared better than those who didn’t complete their diploma with a rate of 6.2%, while those with some college or an associate’s degree had an unemployment rate of 5.6%.
Over the 5-year period from 2009-2013 which includes data collected during the Great Recession, the total unemployment rate for Austin was higher at 7.5%. The map below shows areas with rates above and below that threshold. The lowest rates of 4.0% or less are dispersed throughout the region. Of the 264 block groups within this category, 84 are located at or to the east of I-35. The highest category of unemployment, above 12% (depicted in dark brown), contains 167 block groups also with a wide geographic dispersion with several showing up in the periphery as well as along US-183 in Northwest Travis County, within Central Austin between US-183 and Ben White Blvd., several in Austin south of Ben White, and also in Southeast and East Austin.

Field of Degree & Occupation
Austin continues to attract highly educated talent as new migrants move into the region. In addition to this net gain of talent, the region also has an opportunity to both improve the skills of future workers by assisting with direct-to-college enrollment as well as promoting opportunities to retrain existing workers. The Chamber’s economic development initiative also includes manufacturing as a targeted industry to insure job opportunities and advancement across the educational completion ladder. The ACS provides data that can be used to analyze Austin's existing workforce by field of study for degree holders, as well as by occupation for job holders.
Field of First Major for Bachelor’s Degree Holders
ACS provides data on the field of degree for bachelor recipients’ first major. The majors are grouped into five broad classifications that include: science and engineering, science and engineering-related (pre-med, physical therapy and mechanical engineering technology), business, education, and arts and humanities.
For the Austin metro, the largest degree category is science and engineering (which includes the social sciences) with 38.4%, followed by arts and humanities (25.0%) business (19.8%), education (10.0%), and science and engineering-related (6.7%). To show concentration of where these majors are located throughout the region, we’ve shaded the map below to show which field had the most degree holders for each block group. The darker shade of each color had higher concentration of that field of degree, namely, 40% or more in that block group, while the lighter shade represents the fields with the largest number of recipients in that block group, albeit at less than 40%. For example, a dark purple block group had more than 40% of its bachelor recipients in science and engineering majors, while a light violet shade shows block groups that still had a greater share of science and engineering grads than the other degrees, but at a percentage of less than 40% of the total.

Occupations
Similar to the field of degree data, we’ve mapped the dominate occupation for each block group. The darker shades represents areas where 40% or more of the workers living in that block group worked in that broad occupation category, while the lighter shades show occupations that still had the largest percentage, but were less than 40% of the total. Occupations are reported in the ACS as five main categories management, business, science and arts; service occupations; sales and office occupations; natural resources and construction; and production, transportation and material moving. For the map, we’ve combined both natural resources and construction with the production and material moving category and displayed it in purple. Also the rather broad category of management, business, science, and arts occupations was split into business, finance and management occupations; education, legal and arts; and computer and engineering occupations.
Sales and office represents the largest occupational group for the Austin MSA at 23.2%. Depicted in shades of red, workers in these occupations are the dominate group in 351 of the 967 block groups. The second largest occupational group, management, business, and finance, represents 18.3% of total workers in the region and is the dominate occupation in 209 block groups, shaded green. Service occupations(2) consists of 16.9% of all workers and is the dominate occupation in 137 block groups, shaded yellow. Construction, natural resources, production, transportation and material moving workers (purple on the map) represent 15.9% of workers and was the largest occupation in 180 block groups. Education, legal and arts is the top occupation in 79 block groups, shaded blue and representing 12.6% of all workers in the MSA. Computer, engineering and science occupations represents 84,000 workers, or 8.7% of the total workforce living in the MSA (compared to 5.4% for the entire U.S.). Although this relatively narrow group of occupations is small compared to all of the other broad occupational categories of the economy, 17 block groups actually showed these tech workers as the dominate occupation in that area. Shaded grey on the map, these block groups were found in large numbers in the North Austin-Cedar Park to Round Rock area, as well as a couple near MoPac/US-183 interchange, three in central Austin, and one each in South Austin, Southwest Austin, Pflugerville, and Hutto.

These data and maps gives only a quick snapshot of the Austin economy as displayed by the broad topic of talent at the sub-regional level. To see Austin MSA-level data on workers for 2013, the Census Bureau’s DP03 table, published on American Factfinder, summarizes selected economic data released through the American Community Survey. Also, the Census Bureau developed an interactive map which has many charateritistics including educational attainment mapped at the sub-regional level, though the data is currently still the older 2008-2012 vintage of ACS.
Footnotes:
(1) The Census Bureau announced that going forward in fiscal year 2016, it will only publish American Community Survey one-year, and five-year estimates. Previously, the Census Bureau has also released three-year estimates as an intermediary estimate available for areas of 20,000 covering the average the characteristics over three years. The single year estimates will still be available for areas of 65,000, while all other Census Bureau geographies will have to settle for the annually released estimates aggregating five years of data. For more information see.
(2) Includes healthcare support, protective service, food preparation & serving, building & grounds cleaning & maintenance, and personal care & service.
Related Categories: Central Texas Economy in Perspective