Gross domestic product by metro & county
Sign up for the Central Texas Economy Report newsletter
Posted on 01/07/2020 by Beverly Kerr
- Austin’s economy grew an outstanding 5.6% in 2018, making it the 5th fastest growing major metropolitan area economy.
- Professional and business services was the most significant driver of Austin’s GDP growth in 2018.
- Austin’s real per capita GDP is up 3.0%, the 11th best rate of growth among the top 50 metros.
Austin’s economy grew 5.6% in 2018 according to new data on gross domestic product (GDP) by metro area and county released late last month by the U.S. Bureau of Economic Analysis (BEA). Growth for 2017, which was previously stated as 6.9% has been revised to 5.0%. The compound annual growth rate for 2013-2018 is 5.4%. These growth rates are real, inflation-adjusted, rates. GDP is the value of goods and services produced within a region less the value of goods and services used up in production.
Economic growth in 2018 across U.S. metropolitan areas was widespread. Of 384 metros, 95% saw real gains, compared to 83% in 2017. Aggregate growth for all U.S. metros rose to 3.0% in 2018 after increasing by 2.5% in 2017.

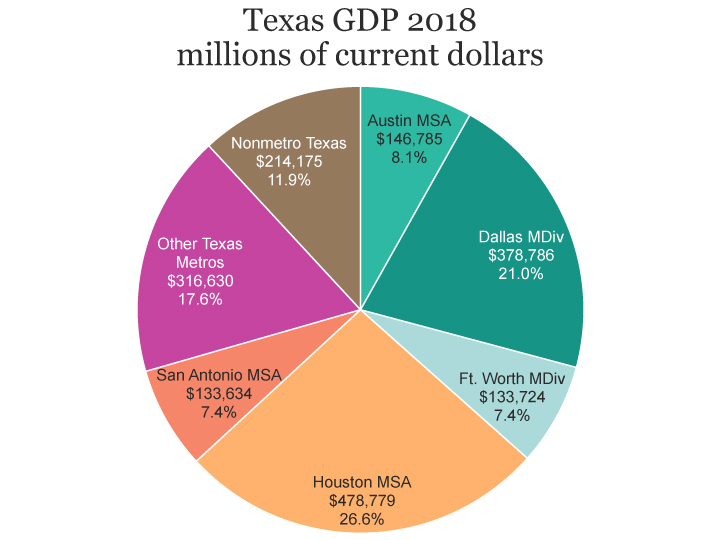
Austin’s 5.6% gain in real GDP is the fifth highest rate of growth among the 50 largest metro economies. San Antonio grew 4.6% and ranked seventh and Dallas-Ft. Worth’s 3.9% growth ranks 13th. Houston’s economy, which had negative growth of 3.1% in 2016 and slight growth of 0.7% in 2017, gained 3.0% in 2018, ranking 23rd.

For the metropolitan portion of the U.S. as a whole, and for Austin, 2009 is the recession low-point for real GDP and positive growth resumes in 2010. Over the last 5 years, real GDP is up 13.5% in the metropolitan portion of the U.S. In Austin, real GDP has grown 30.3% since 2013, making it the second fastest growing major economy—behind only San Jose. San Antonio (up 24.0%), Dallas-Ft. Worth (up 21.3%), and Houston (up 6.2%) rank as the seventh, 12th and 43rd fastest growing large metros for 2013-2018.

Austin’s current dollar GDP totals $147 billion in 2018, making it the 26th largest U.S. metropolitan economy. On the basis of population in 2018, the Austin metro ranks 30th. At the time of last year’s release of this data, Austin’s GDP ranked 24th. Austin’s current dollar series seems to have been significantly revised from last year such that 2017 is now estimated at $137 billion instead of $149 billion. The difference is just over 8%, but among major metros, revised figures are as much as 12% higher or lower than initial estimates for 2017. This year’s estimates incorporate new and additional source data and methodology improvements related to the expansion of statistics of GDP by county.

While 95% of all metropolitan economies grew in real terms in 2018, 98% of the 50 largest metros grew (only Bridgeport, CT) had negative growth in 2018). In aggregate, their growth was 3.2%, slightly greater than the 3.0% real gain for the entire metropolitan portion of the U.S. The 50 largest metros account for 71% of U.S. metropolitan area GDP.

Per Capita GDP
Austin’s real GDP on a per capita basis performed well relative to other large metros over both 2017-2018 and 2013-2018. Austin ranks 11th with 3.0% real growth in per capita GDP in 2018, while the growth for all metros was 2.2%. San Antonio’s gain was 2.8% (ranking 12th), Dallas-Ft. Worth’s was 2.1% (28th), and Houston’s was 1.7% (37th). Only one metro, Hartford, CT, had negative growth in real per capita GDP in 2018.

Since 2013, real per capita GDP is up 13.2% in Austin, making it the seventh best performing large metro. Across all metros, 2013-2018 growth was 9.0%. San Antonio’s and Dallas-Ft. Worth’s increases are 12.3% and 9.7% respectively (ranking 11th and 21st). In Houston, real per capita GDP is 3.9% below what it was five years ago (ranking 50th). The only other metro with a decline in real per capita GDP over the period is Bridgeport, CT. Gains in real GDP on a per capita basis reflect improvement in an area’s standard of living.
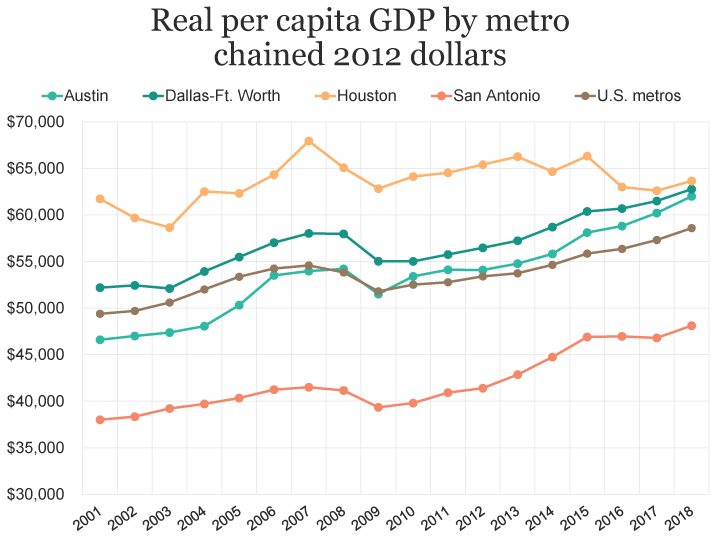
The pre-recession peak for real per capita GDP across all metros was 2007. For the metropolitan portion of the U.S., 2018 real per capita GDP surpasses 2007 by 7.3%. Of the 50 largest metros, 13 still have real per capita GDP that is lower than what it was in 2007. Three large metros—Las Vegas, Bridgeport, and New Orleans—have real per capita GDP in 2018 that is more than 10% below the level of 2007. In San Jose, real per capita income exceeds 2007 by more than 80%. Austin’s is up by 14.9% (ranking 10th).
GDP by Industry
All private industry sectors contributed positively to U.S. metropolitan area real GDP growth of 3.0% in 2018. Professional and business services (0.71 percentage points), information (0.47), and manufacturing (0.43) made the greatest contributions to growth of U.S. metros in aggregate. Information only accounts for 5.6% of GDP for the metropolitan portion of the U.S., but it was the fastest growing industry sector in 2018, with 8.7% real growth.
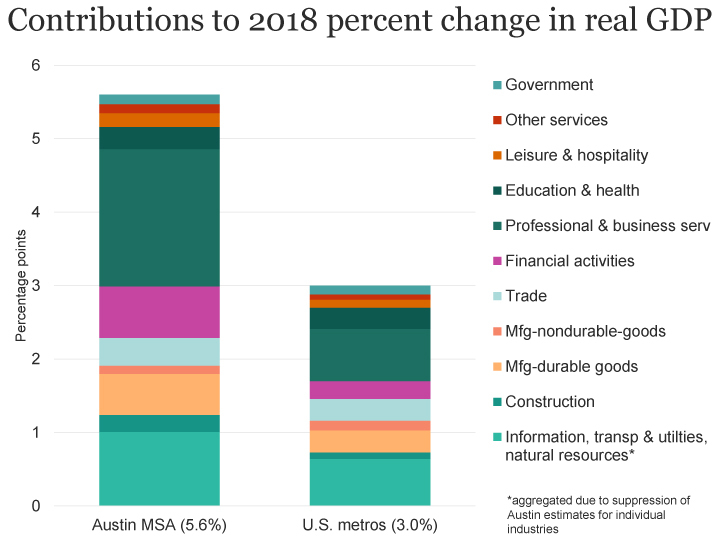
In Austin, where real GDP growth was 5.6%, professional and business services contributed the most to growth (1.87 percentage points). Manufacturing (0.68) and financial activities (0.70) were also notable. Data suppression of estimates for information and utilities clouds the relative contributions of these sectors, but based on data for Travis County (see below), information is likely also a relatively strong contributor to the metro’s growth.[1]

Professional and business services is Austin’s largest industry sector, accounting for 16.9% of 2018 GDP. It also saw the fastest rate of real growth, 11.6%, in 2018. The other two industries with double-digit real growth in 2018 were information and transportation and utilities. Austin’s second most significant industry, financial activities, accounted for 15.1% of 2018 GDP and grew by 4.6%—slightly less than the 5.6% overall real GDP growth in 2018.

The standouts in Austin for growth over the last five years are professional and business services and information—both sectors seeing real growth of 53.0%—followed by construction with 48.1%.

Dallas-Ft. Worth, the sixth largest metro economy, ranked 13th for growth in 2018. The metro’s 3.9% gain was driven by professional and business services (1.07 percentage points) and manufacturing (0.63). Natural resources and mining contributed negatively (-0.34).
Houston, the seventh largest metro economy, grew by 3.0% in 2018 (ranking 23rd). Manufacturing (0.92 percentage points) and professional and business services (0.91) were the largest contributors to growth. Natural resources and mining contributed negatively (-0.42).
San Antonio, with the 32nd largest metro economy, had real growth of 4.6% (ranking seventh) and the largest contributors to growth in 2018 were financial activities (1.04) and manufacturing (0.93).
GDP by County
Among the Austin MSA’s five counties, Travis County saw the fastest growth (6.0%) in real GDP in 2018. Each county, except Williamson, improved on 2017 growth rates. Williamson County, which was the fastest growing last year (6.9%), had the lowest growth in 2018 (3.7%).

After releasing “prototype” GDP by county statistics in December 2018, the BEA expands county data with industry detail this year.
Travis County’s 6.0% real growth was driven by professional and business services (2.18 percentage points), information (0.83), manufacturing (0.78), and financial services (0.72).
In Williamson County, professional and business services contributed 1.06 percentage points to the county’s 3.7% real growth and financial activities was the next largest contributor (0.65). Wholesale trade contributed negatively (0.70). Construction provided the largest contributions to percent change in Bastrop and Hays Counties. In Caldwell County, construction was also significant, but retail trade accounted a larger portion of that county’s 5.9% growth.

A look at this decade’s annual percent change in real GDP by county might prompt consideration of what may be going on in Caldwell County.
A glance at the time series data by industry for the county called attention to construction and to mining, quarrying, and oil and gas extraction. The following graphs show the shares of private goods-producing industries, private service-providing industries, and government in Caldwell County’s real GDP; each county’s reliance on private goods producing industries; and real GDP for each private goods-producing industry in Caldwell County.


Presumably, the construction industry trend line largely illustrates the impact within Caldwell County of the construction of the final stages of State Highway 130, which began in 2009. What circumstances created the five-year ballooning of GDP due mining, quarrying, and oil and gas extraction might be something to inquire into. Comparing the county’s industry trend line to that of other Texas regions did not offer signals that the trend in the value of the industry’s production locally might be correlated with larger industry conditions.
FOOTNOTES:
- The BEA suppresses industry detail where publication has the potential to reveal information about individual or small numbers of businesses. This year, the BEA introduced county-level GDP estimates, which has multiplied the incidences of suppression for confidentiality. The data suppression of a few industries for the Austin MSA is due to suppression of these industries in the estimates for Bastrop County. Bastrop County accounts for about 1.5% of the metro’s total GDP. We made 2018 estimates of Bastrop County GDP for the small information and management of companies industries based on 2017, derived utilities, and added these to the published estimates for Caldwell, Hays, Travis and Williamson County to create Austin MSA estimates where 2018 data was suppressed. While Bastrop represents a very small portion of the metro’s total economy, it should be noted that it is a significant contributor to the region’s GDP attributable to utilities. ↩
Related Categories: Central Texas Economy in Perspective